Components / data-display
Chart
Plots one or two series over time as bars or a line, shows the value of a point on touch, drag or arrow keys, reads a summary and every point to screen readers, and offers the same data as a table.
Import
In a Flutter app where fliin init has run:
Examples
Bar
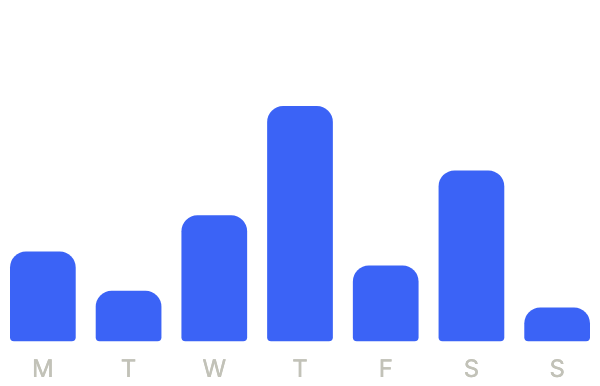
A week of spending as bars. formatValue writes each amount; summary gives the screen reader the point of the chart.
import 'package:your_app/ui/fliin/components/chart/fl_chart.dart';
import 'package:flutter/widgets.dart';

const _week = [
  FlChartPoint('M', semanticLabel: 'Monday'),
  FlChartPoint('T', semanticLabel: 'Tuesday'),
  FlChartPoint('W', semanticLabel: 'Wednesday'),
  FlChartPoint('T', semanticLabel: 'Thursday'),
  FlChartPoint('F', semanticLabel: 'Friday'),
  FlChartPoint('S', semanticLabel: 'Saturday'),
  FlChartPoint('S', semanticLabel: 'Sunday'),
];

const _spending = FlChartSeries(label: 'Spending', values: [32, 18, 45, 84, 27, 61, 12]);

String _euros(double value) => '€${value.round()}';

class ChartBarExample extends StatelessWidget {
  const ChartBarExample({super.key});

  @override
  Widget build(BuildContext context) {
    return FlChart.bar(
      points: _week,
      series: const [_spending],
      formatValue: _euros,
      semanticLabel: 'Spending this week',
      summary: 'highest on Thursday, €84',
      plotHeight: 140,
    );
  }
}Selected
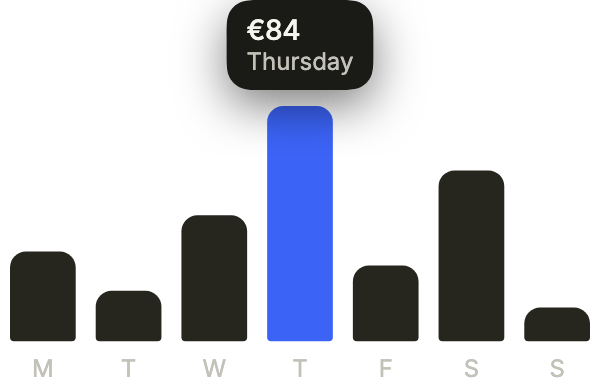
A bar selected from the start with initialSelection: its value shows above the chart. Touching another bar moves the selection.
import 'package:your_app/ui/fliin/components/chart/fl_chart.dart';
import 'package:flutter/widgets.dart';

const _week = [
  FlChartPoint('M', semanticLabel: 'Monday'),
  FlChartPoint('T', semanticLabel: 'Tuesday'),
  FlChartPoint('W', semanticLabel: 'Wednesday'),
  FlChartPoint('T', semanticLabel: 'Thursday'),
  FlChartPoint('F', semanticLabel: 'Friday'),
  FlChartPoint('S', semanticLabel: 'Saturday'),
  FlChartPoint('S', semanticLabel: 'Sunday'),
];

const _spending = FlChartSeries(label: 'Spending', values: [32, 18, 45, 84, 27, 61, 12]);

String _euros(double value) => '€${value.round()}';

class ChartSelectedExample extends StatelessWidget {
  const ChartSelectedExample({super.key});

  @override
  Widget build(BuildContext context) {
    return FlChart.bar(
      points: _week,
      series: const [_spending],
      formatValue: _euros,
      semanticLabel: 'Spending this week',
      plotHeight: 140,
      initialSelection: 3,
    );
  }
}Compare
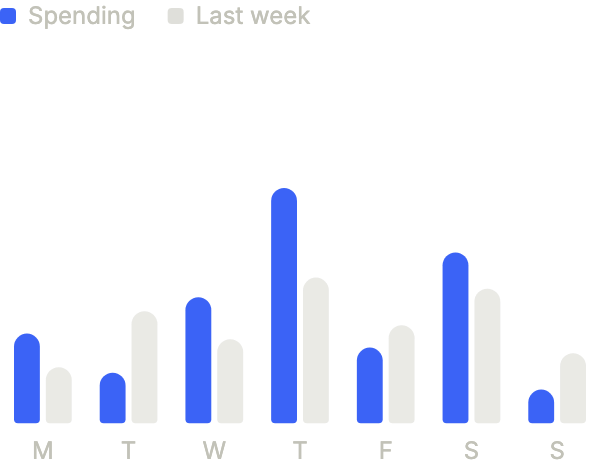
Two series side by side, this week against the last, with a legend.
import 'package:your_app/ui/fliin/components/chart/fl_chart.dart';
import 'package:flutter/widgets.dart';

const _week = [
  FlChartPoint('M', semanticLabel: 'Monday'),
  FlChartPoint('T', semanticLabel: 'Tuesday'),
  FlChartPoint('W', semanticLabel: 'Wednesday'),
  FlChartPoint('T', semanticLabel: 'Thursday'),
  FlChartPoint('F', semanticLabel: 'Friday'),
  FlChartPoint('S', semanticLabel: 'Saturday'),
  FlChartPoint('S', semanticLabel: 'Sunday'),
];

const _spending = FlChartSeries(label: 'Spending', values: [32, 18, 45, 84, 27, 61, 12]);

String _euros(double value) => '€${value.round()}';

class ChartCompareExample extends StatelessWidget {
  const ChartCompareExample({super.key});

  @override
  Widget build(BuildContext context) {
    return FlChart.bar(
      points: _week,
      series: const [
        _spending,
        FlChartSeries(label: 'Last week', values: [20, 40, 30, 52, 35, 48, 25]),
      ],
      formatValue: _euros,
      semanticLabel: 'Spending per day',
      plotHeight: 140,
    );
  }
}Line
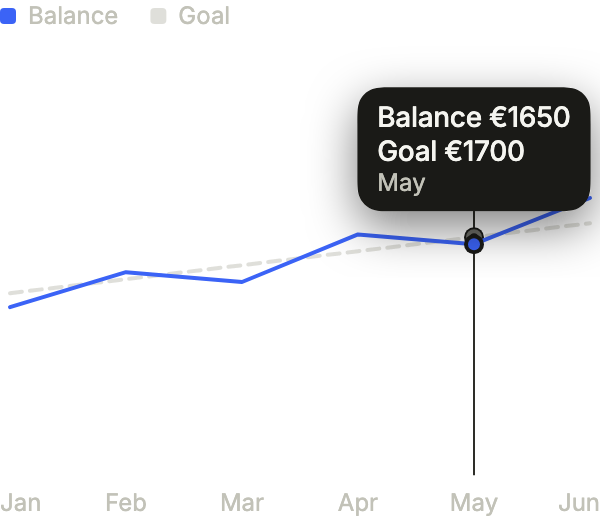
A trend over months as lines: the balance against its goal, May selected.
import 'package:your_app/ui/fliin/components/chart/fl_chart.dart';
import 'package:flutter/widgets.dart';

String _euros(double value) => '€${value.round()}';

class ChartLineExample extends StatelessWidget {
  const ChartLineExample({super.key});

  @override
  Widget build(BuildContext context) {
    return FlChart.line(
      points: const [
        FlChartPoint('Jan'),
        FlChartPoint('Feb'),
        FlChartPoint('Mar'),
        FlChartPoint('Apr'),
        FlChartPoint('May'),
        FlChartPoint('Jun'),
      ],
      series: const [
        FlChartSeries(label: 'Balance', values: [1200, 1450, 1380, 1720, 1650, 1980]),
        FlChartSeries(label: 'Goal', values: [1300, 1400, 1500, 1600, 1700, 1800]),
      ],
      formatValue: _euros,
      semanticLabel: 'Balance over time',
      plotHeight: 140,
      initialSelection: 4,
    );
  }
}Table
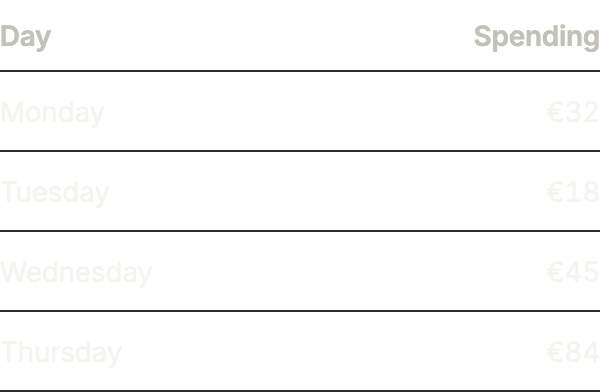
The same figures as a table: FlChartTable for when exact values matter more than the shape, or as the accessible twin of a chart.
import 'package:your_app/ui/fliin/components/chart/fl_chart.dart';
import 'package:flutter/widgets.dart';

const _week = [
  FlChartPoint('M', semanticLabel: 'Monday'),
  FlChartPoint('T', semanticLabel: 'Tuesday'),
  FlChartPoint('W', semanticLabel: 'Wednesday'),
  FlChartPoint('T', semanticLabel: 'Thursday'),
  FlChartPoint('F', semanticLabel: 'Friday'),
  FlChartPoint('S', semanticLabel: 'Saturday'),
  FlChartPoint('S', semanticLabel: 'Sunday'),
];

const _spending = FlChartSeries(label: 'Spending', values: [32, 18, 45, 84, 27, 61, 12]);

String _euros(double value) => '€${value.round()}';

class ChartTableExample extends StatelessWidget {
  const ChartTableExample({super.key});

  @override
  Widget build(BuildContext context) {
    return FlChartTable(
      points: _week.take(4).toList(),
      series: const [_spending],
      formatValue: _euros,
      pointsLabel: 'Day',
    );
  }
}Area
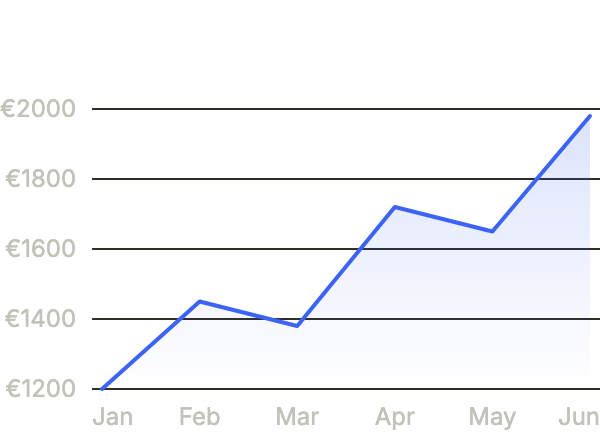
A balance as an area: area fills under the line, and zeroBased: false fits the scale to the values, so that the moves between €1,200 and €1,980 show.
import 'package:your_app/ui/fliin/components/chart/fl_chart.dart';
import 'package:flutter/widgets.dart';

String _euros(double value) => '€${value.round()}';

class ChartAreaExample extends StatelessWidget {
  const ChartAreaExample({super.key});

  @override
  Widget build(BuildContext context) {
    return FlChart.line(
      points: const [
        FlChartPoint('Jan', semanticLabel: 'January'),
        FlChartPoint('Feb', semanticLabel: 'February'),
        FlChartPoint('Mar', semanticLabel: 'March'),
        FlChartPoint('Apr', semanticLabel: 'April'),
        FlChartPoint('May', semanticLabel: 'May'),
        FlChartPoint('Jun', semanticLabel: 'June'),
      ],
      series: const [
        FlChartSeries(label: 'Balance', values: [1200, 1450, 1380, 1720, 1650, 1980]),
      ],
      formatValue: _euros,
      semanticLabel: 'Balance over six months',
      summary: 'up from €1,200 to €1,980',
      plotHeight: 140,
      area: true,
      zeroBased: false,
      showValueAxis: true,
    );
  }
}Colors
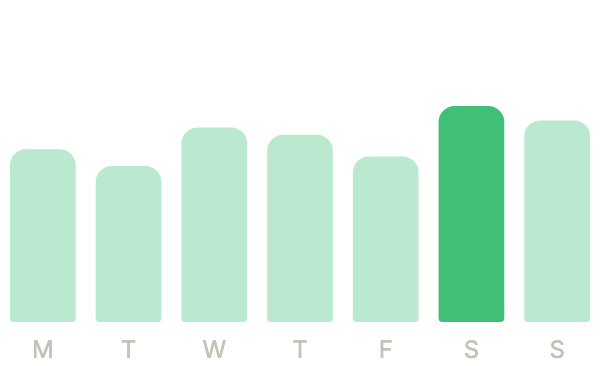
A series in the app's own color: FlChartSeries.color takes a category's or a brand's color, here the theme's success, for the bars, the legend and the dimmed bars around a selection.
import 'package:your_app/ui/fliin/components/chart/fl_chart.dart';
import 'package:your_app/ui/fliin/core/fliin.dart';
import 'package:flutter/widgets.dart';

String _hours(double value) => '${value.toStringAsFixed(1)} h';

class ChartColorsExample extends StatelessWidget {
  const ChartColorsExample({super.key});

  @override
  Widget build(BuildContext context) {
    return FlChart.bar(
      points: const [
        FlChartPoint('M', semanticLabel: 'Monday'),
        FlChartPoint('T', semanticLabel: 'Tuesday'),
        FlChartPoint('W', semanticLabel: 'Wednesday'),
        FlChartPoint('T', semanticLabel: 'Thursday'),
        FlChartPoint('F', semanticLabel: 'Friday'),
        FlChartPoint('S', semanticLabel: 'Saturday'),
        FlChartPoint('S', semanticLabel: 'Sunday'),
      ],
      series: [
        FlChartSeries(
          label: 'Sleep',
          values: const [7.2, 6.5, 8.1, 7.8, 6.9, 9.0, 8.4],
          color: FlScope.of(context).colors.success,
        ),
      ],
      formatValue: _hours,
      semanticLabel: 'Sleep this week',
      plotHeight: 120,
      highlight: 5,
    );
  }
}Usage
The code the reference images render:
final example = Builder(
  builder: (context) {
    final days = [
      FlChartPoint('M', semanticLabel: 'Monday'),
      FlChartPoint('T', semanticLabel: 'Tuesday'),
      FlChartPoint('W', semanticLabel: 'Wednesday'),
      FlChartPoint('T', semanticLabel: 'Thursday'),
      FlChartPoint('F', semanticLabel: 'Friday'),
      FlChartPoint('S', semanticLabel: 'Saturday'),
      FlChartPoint('S', semanticLabel: 'Sunday'),
    ];
    final spent = FlChartSeries(
      label: 'Spending',
      values: const [32, 18, 45, 84, 27, 61, 12],
    );
    final before = FlChartSeries(
      label: 'Previous week',
      values: const [20, 40, 30, 52, 35, 48, 25],
    );
    return ColoredBox(
      color: FlScope.of(context).colors.surface,
      child: SingleChildScrollView(
        padding: EdgeInsetsDirectional.all(FlScope.of(context).space.lg),
        child: Column(
          crossAxisAlignment: CrossAxisAlignment.stretch,
          spacing: FlScope.of(context).space.xl,
          children: [
            FlChart.bar(
              points: days,
              series: [spent],
              formatValue: (double value) => '€${value.round()}',
              semanticLabel: 'This week’s spending',
              plotHeight: 120,
              initialSelection: 3,
            ),
            FlChart.bar(
              points: days,
              series: [spent, before],
              formatValue: (double value) => '€${value.round()}',
              semanticLabel: 'Spending per day',
              plotHeight: 100,
            ),
            FlChart.line(
              points: [
                FlChartPoint('Jan'),
                FlChartPoint('Feb'),
                FlChartPoint('Mar'),
                FlChartPoint('Apr'),
                FlChartPoint('May'),
                FlChartPoint('Jun'),
              ],
              series: [
                FlChartSeries(
                  label: 'Balance',
                  values: const [1200, 1450, 1380, 1720, 1650, 1980],
                ),
                FlChartSeries(
                  label: 'Goal',
                  values: const [1300, 1400, 1500, 1600, 1700, 1800],
                ),
              ],
              formatValue: (double value) => '€${value.round()}',
              semanticLabel: 'Balance over time',
              plotHeight: 100,
              initialSelection: 4,
            ),
            FlChartTable(
              points: days.take(3).toList(),
              series: [spent],
              formatValue: (double value) => '€${value.round()}',
              pointsLabel: 'Day',
            ),
          ],
        ),
      ),
    );
  },
);API
FlChartType: enum {bar, line}
FlChartType.bar: static final FlChartType
FlChartType.line: static final FlChartType
FlChartPoint: final class
FlChartPoint.new: const new(String label, {String? semanticLabel})
FlChartPoint.label: get String
FlChartPoint.semanticLabel: get String?
FlChartSeries: final class
FlChartSeries.new: const new({required String label, required List<double> values, Color? color})
FlChartSeries.label: get String
FlChartSeries.color: get Color?
FlChartSeries.values: get List<double>
FlChart: class extends StatefulWidget
FlChart.bar: const new({super.key, required List<FlChartPoint> points, required List<FlChartSeries> series, required String Function(double value) formatValue, String Function(double value)? formatAxis, double? axisUnit, required String semanticLabel, String? summary, double plotHeight, int? initialSelection, int? highlight, bool showValueAxis, bool showTimeAxis, bool tooltip})
FlChart.line: const new({super.key, required List<FlChartPoint> points, required List<FlChartSeries> series, required String Function(double value) formatValue, String Function(double value)? formatAxis, double? axisUnit, required String semanticLabel, String? summary, double plotHeight, int? initialSelection, int? highlight, bool showValueAxis, bool showTimeAxis, bool tooltip, bool area, bool zeroBased})
FlChart.type: get FlChartType
FlChart.points: get List<FlChartPoint>
FlChart.series: get List<FlChartSeries>
FlChart.formatValue: get String Function(double value)
FlChart.formatAxis: get String Function(double value)?
FlChart.axisUnit: get double?
FlChart.semanticLabel: get String
FlChart.summary: get String?
FlChart.plotHeight: get double
FlChart.initialSelection: get int?
FlChart.highlight: get int?
FlChart.showValueAxis: get bool
FlChart.showTimeAxis: get bool
FlChart.tooltip: get bool
FlChart.area: get bool
FlChart.zeroBased: get bool
FlChart.createState: State<FlChart>()
FlChartTable: class extends StatelessWidget
FlChartTable.new: const new({super.key, required List<FlChartPoint> points, required List<FlChartSeries> series, required String Function(double value) formatValue, required String pointsLabel})
FlChartTable.points: get List<FlChartPoint>
FlChartTable.series: get List<FlChartSeries>
FlChartTable.formatValue: get String Function(double value)
FlChartTable.pointsLabel: get String
FlChartTable.build: Widget(BuildContext context)Reference renders
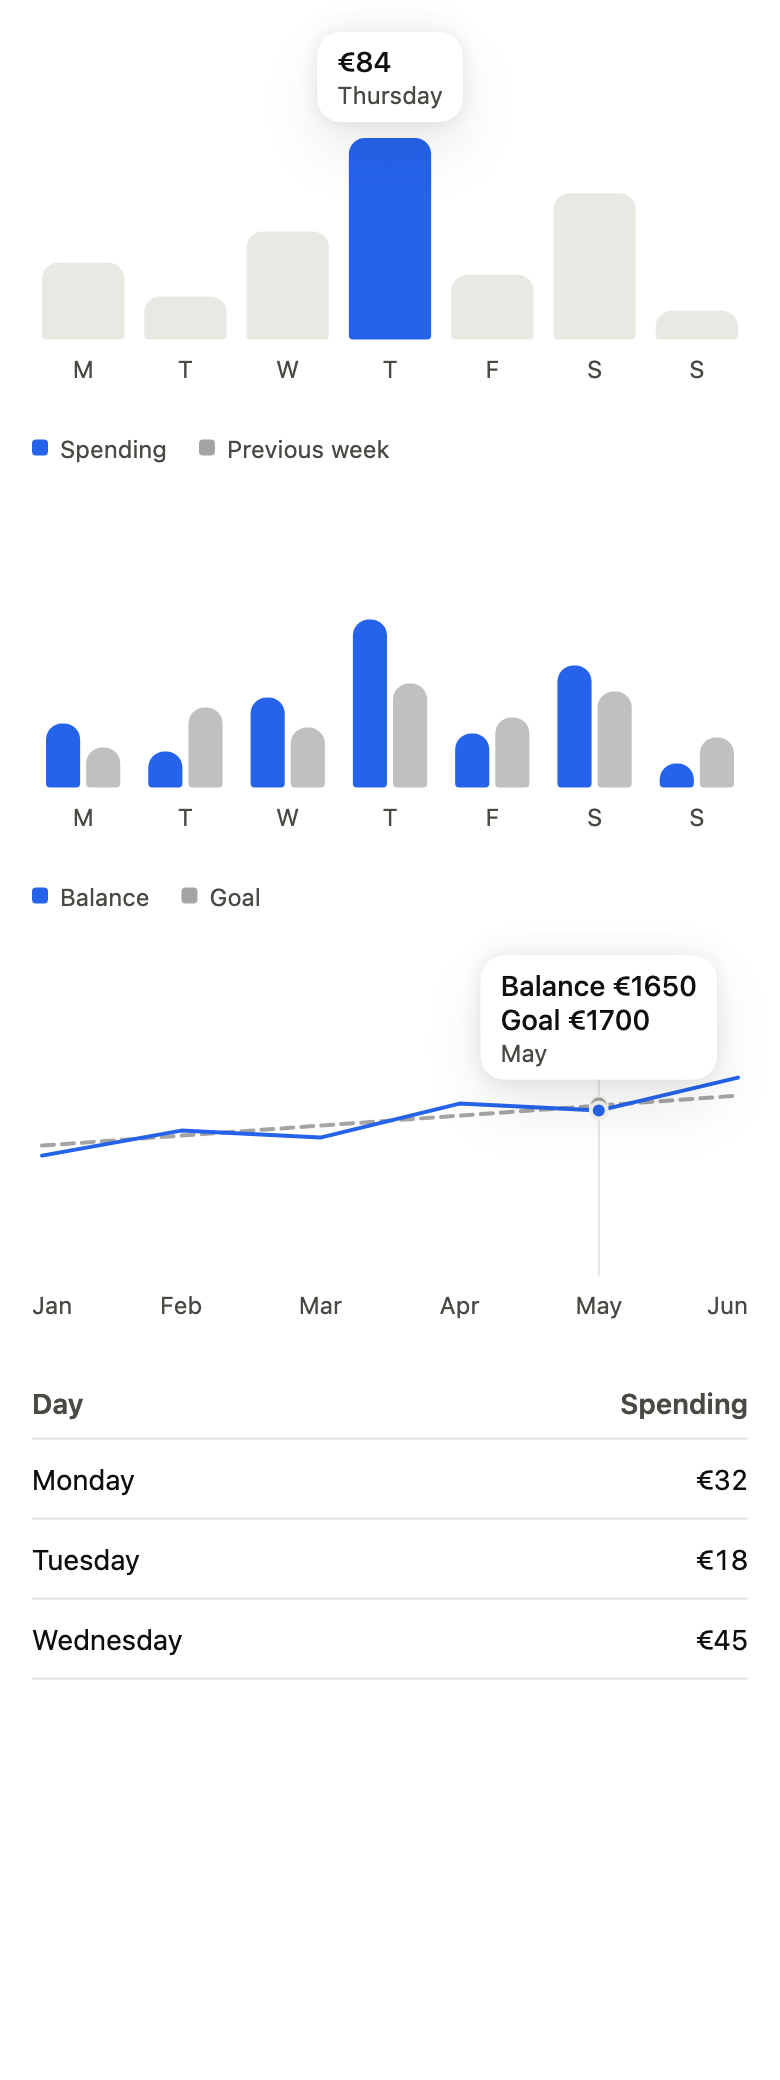
The 16 images published with version 0.2.4, rendered by the shared harness on macOS with Flutter 3.47.7. fliin verify chart compares your copy to them.
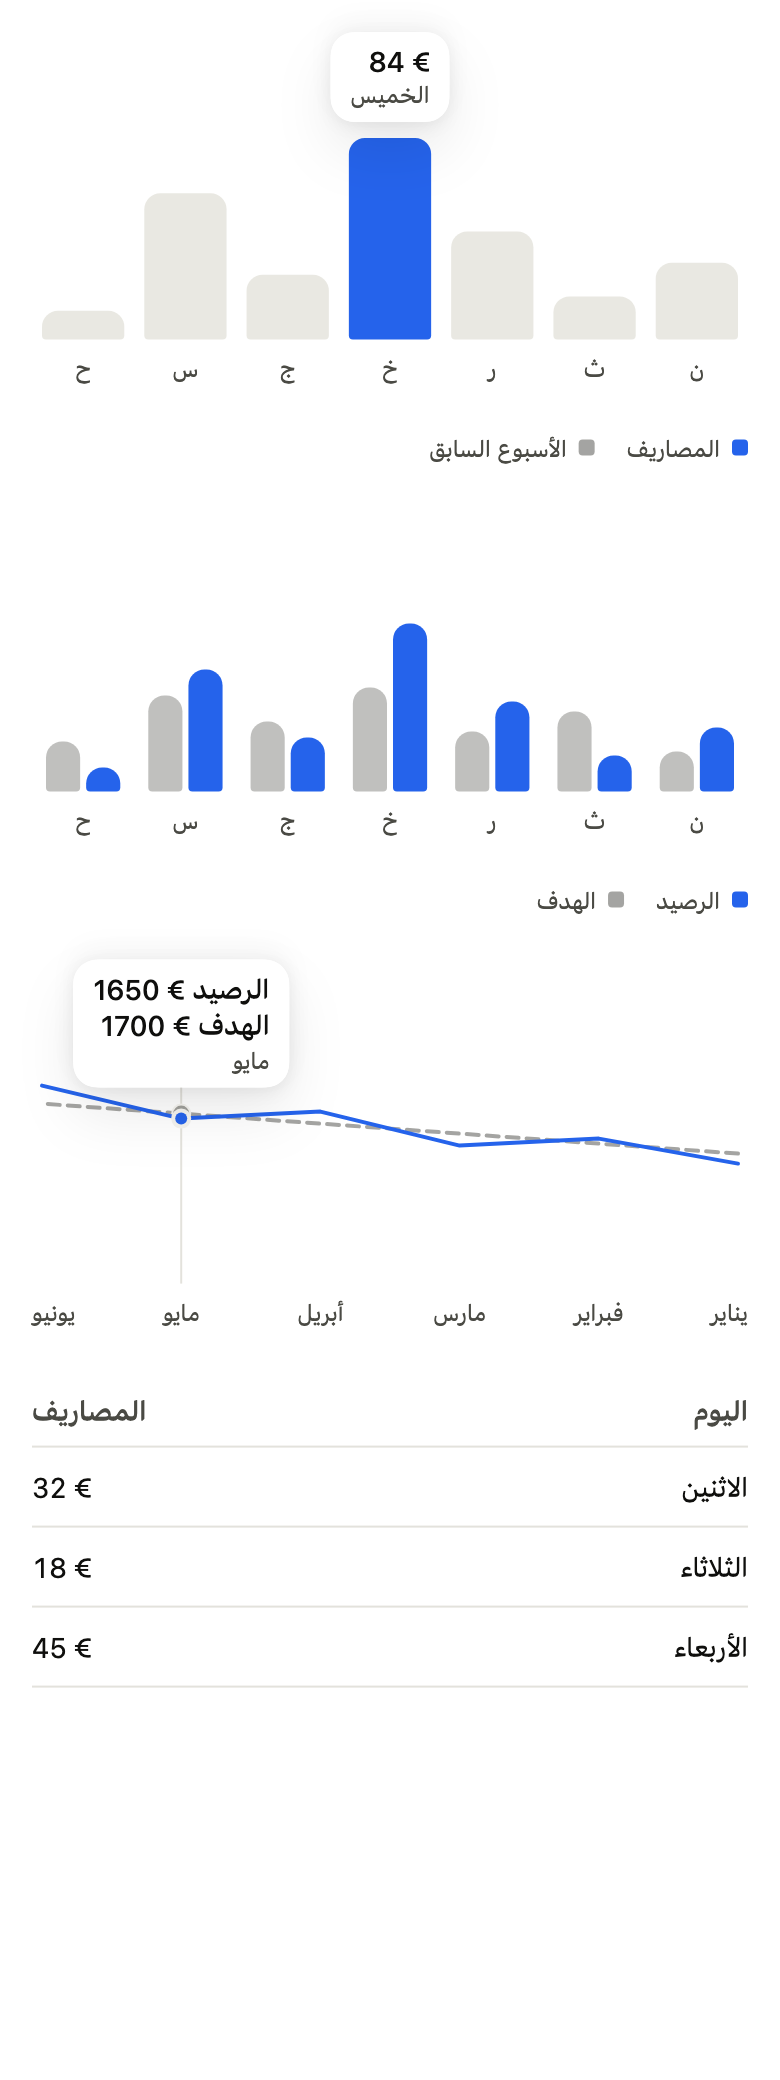
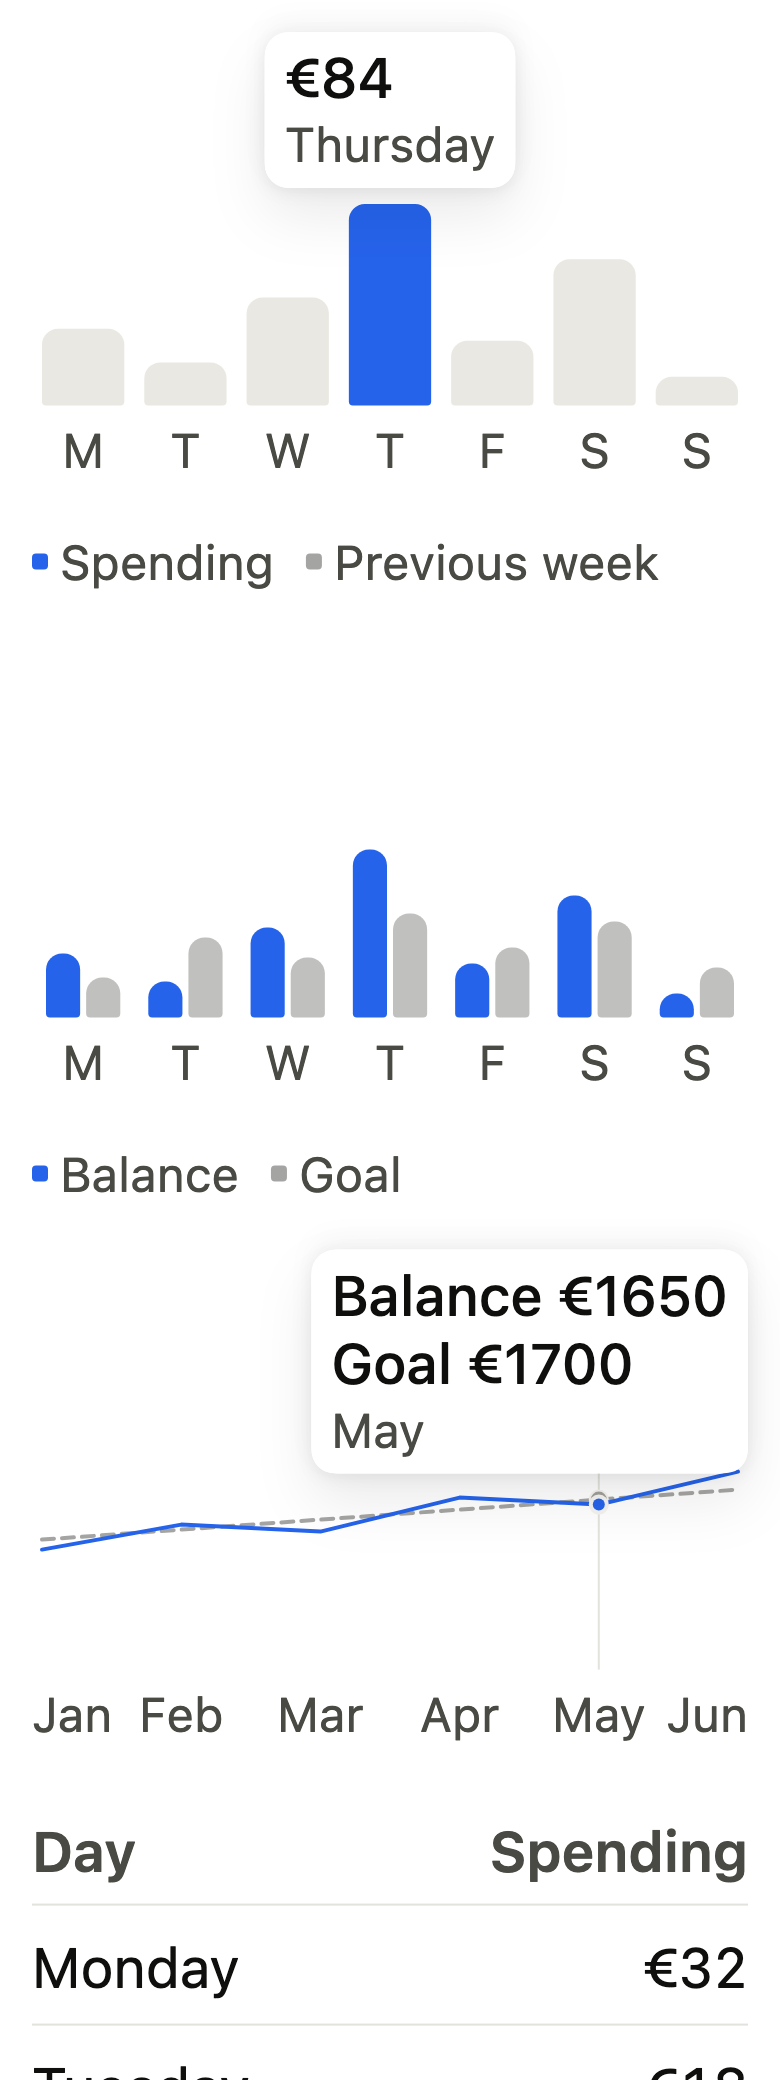
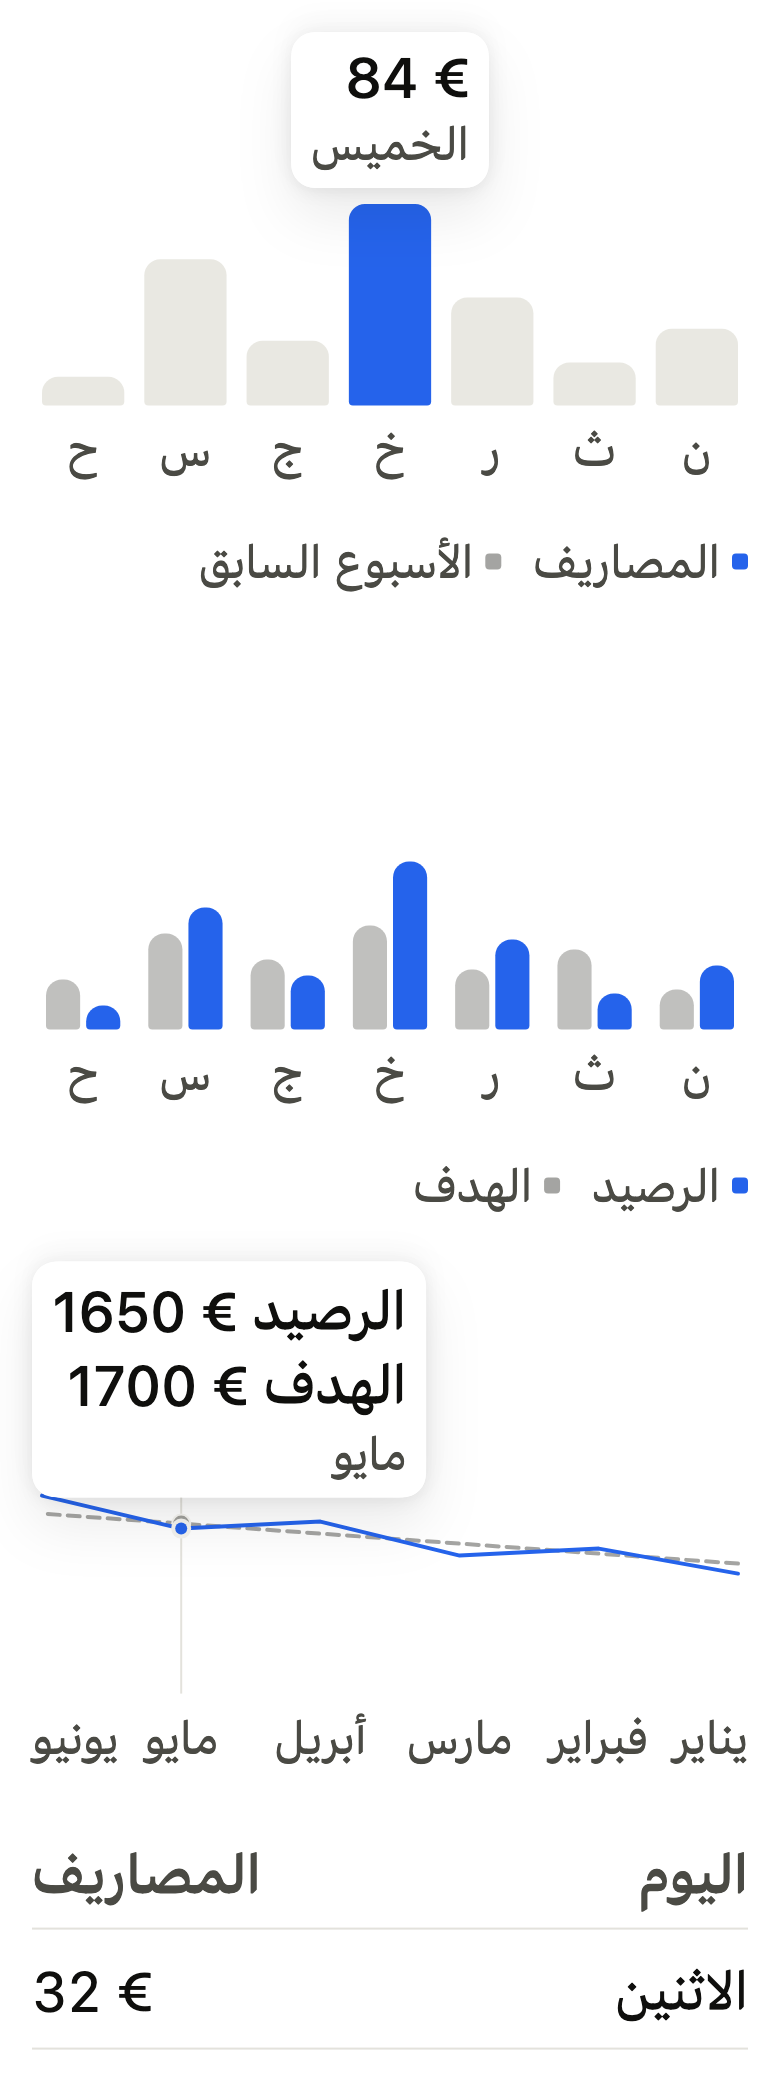
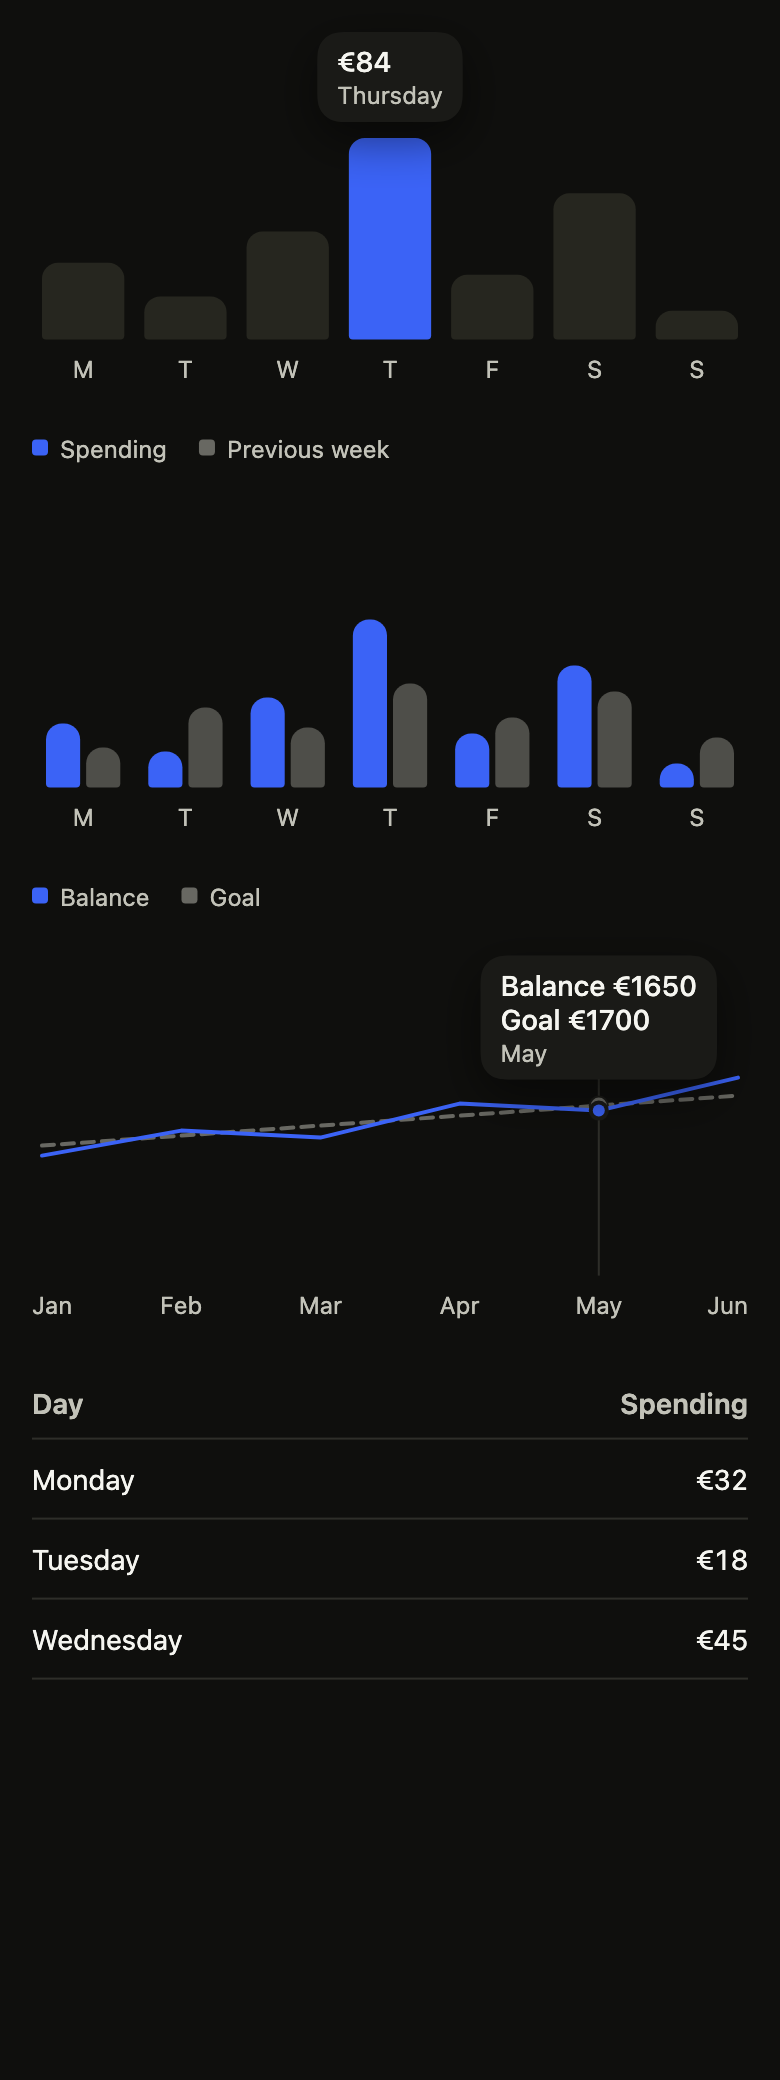
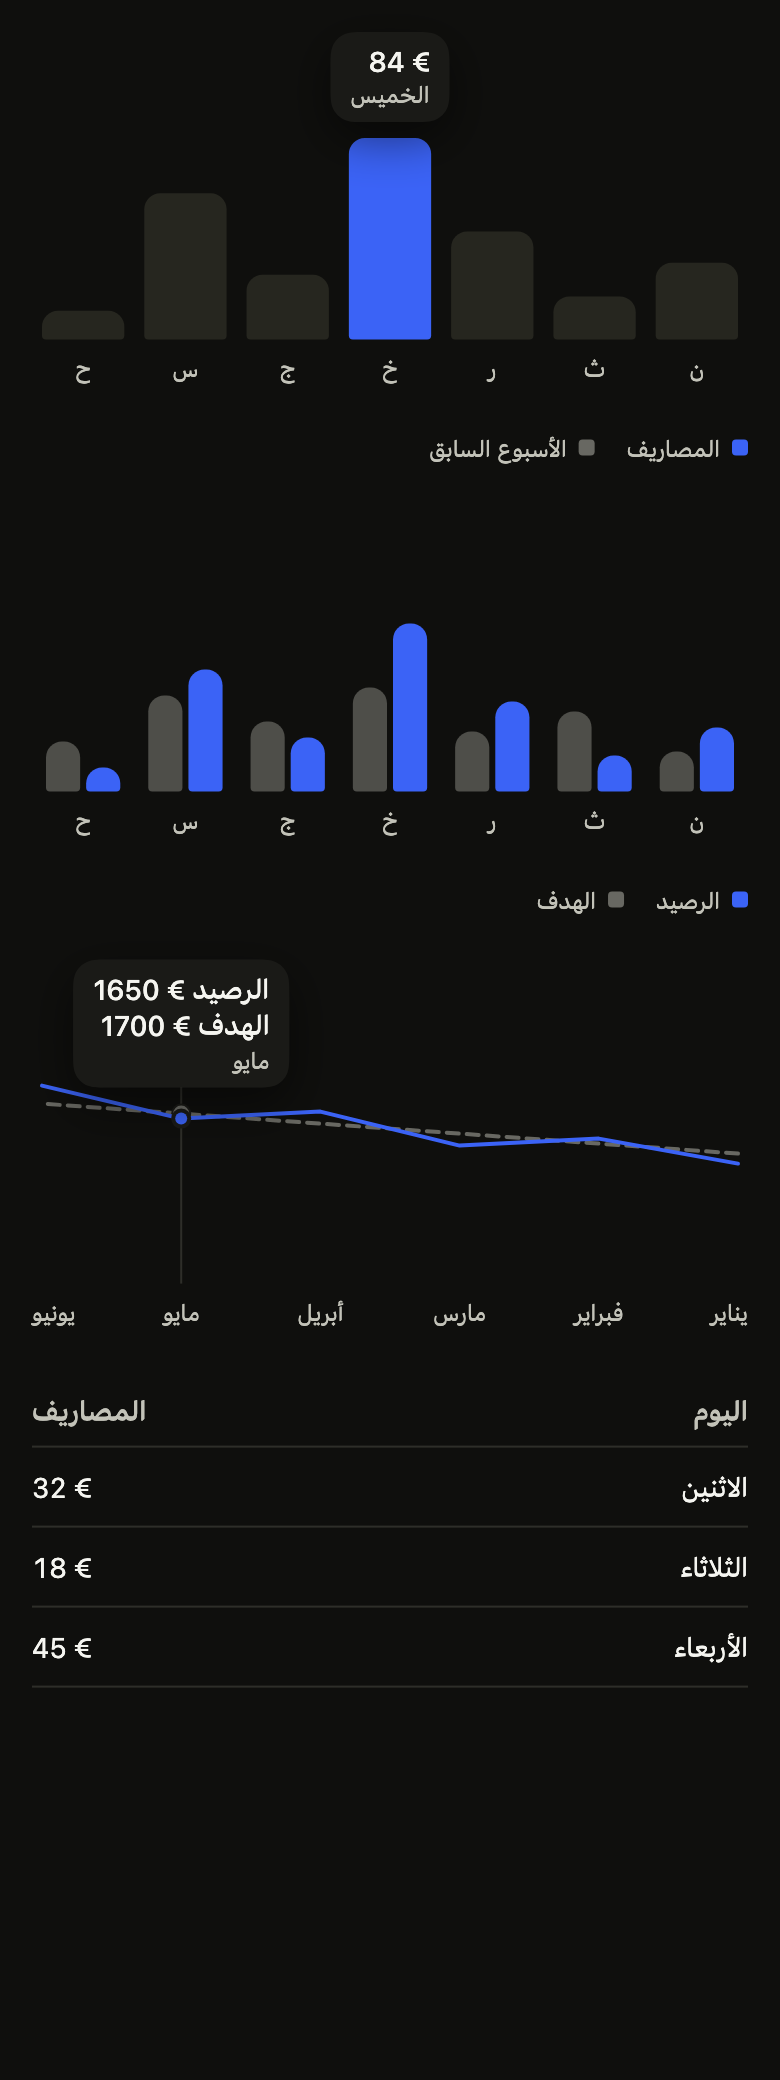
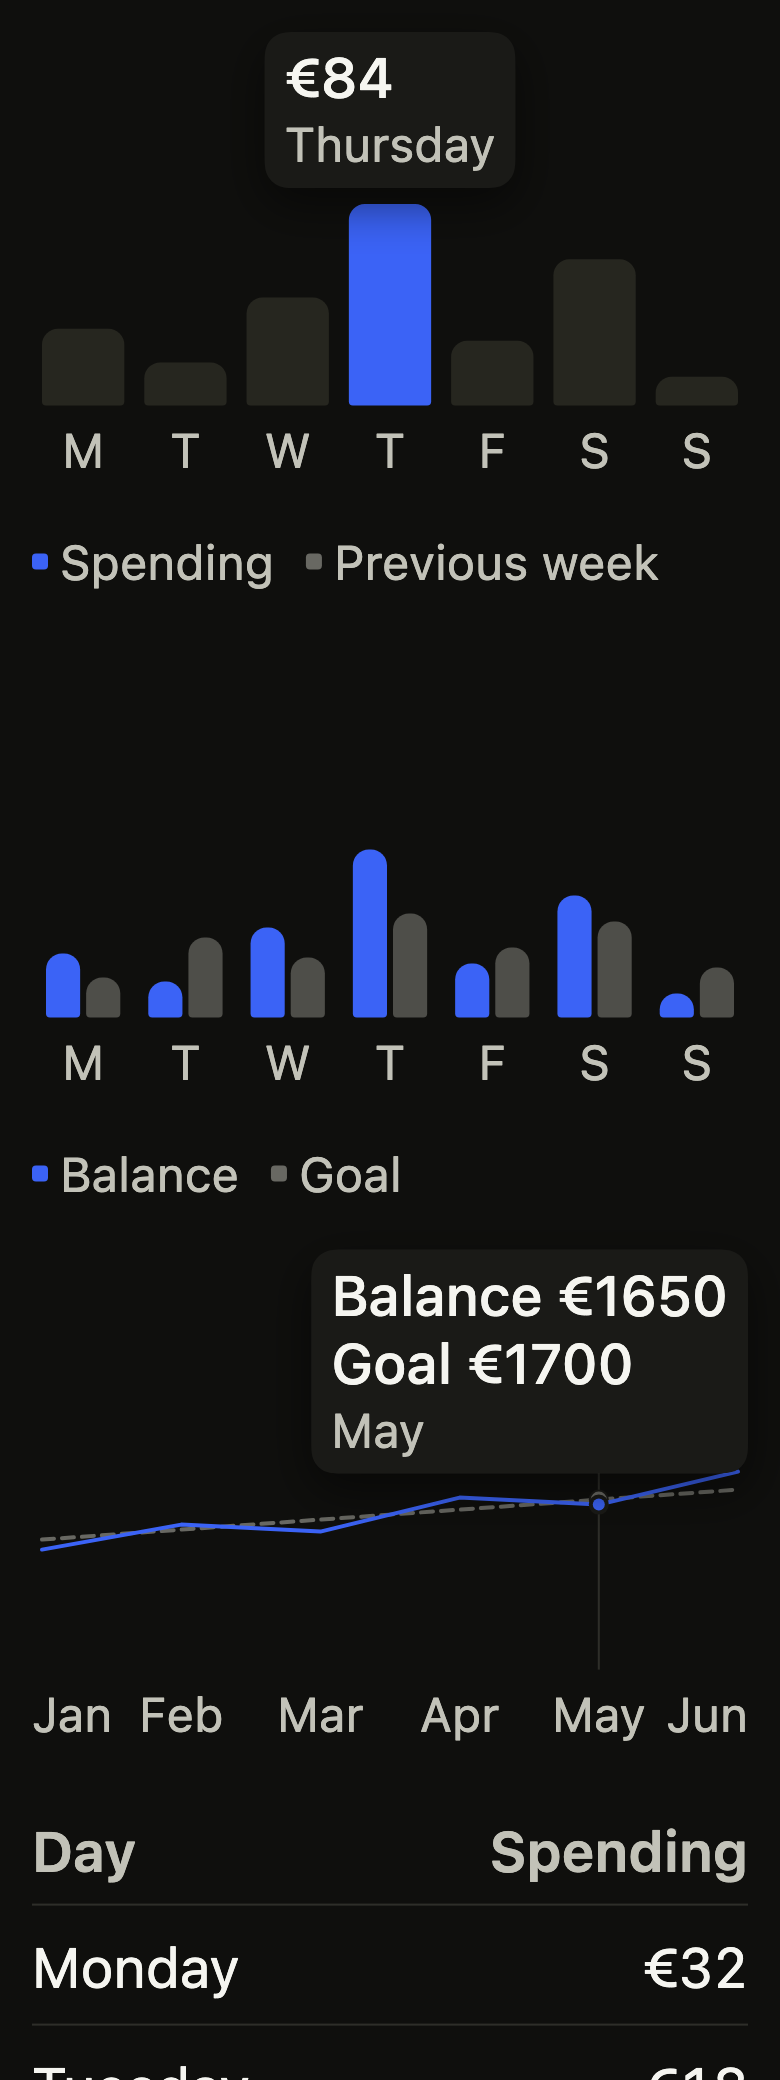
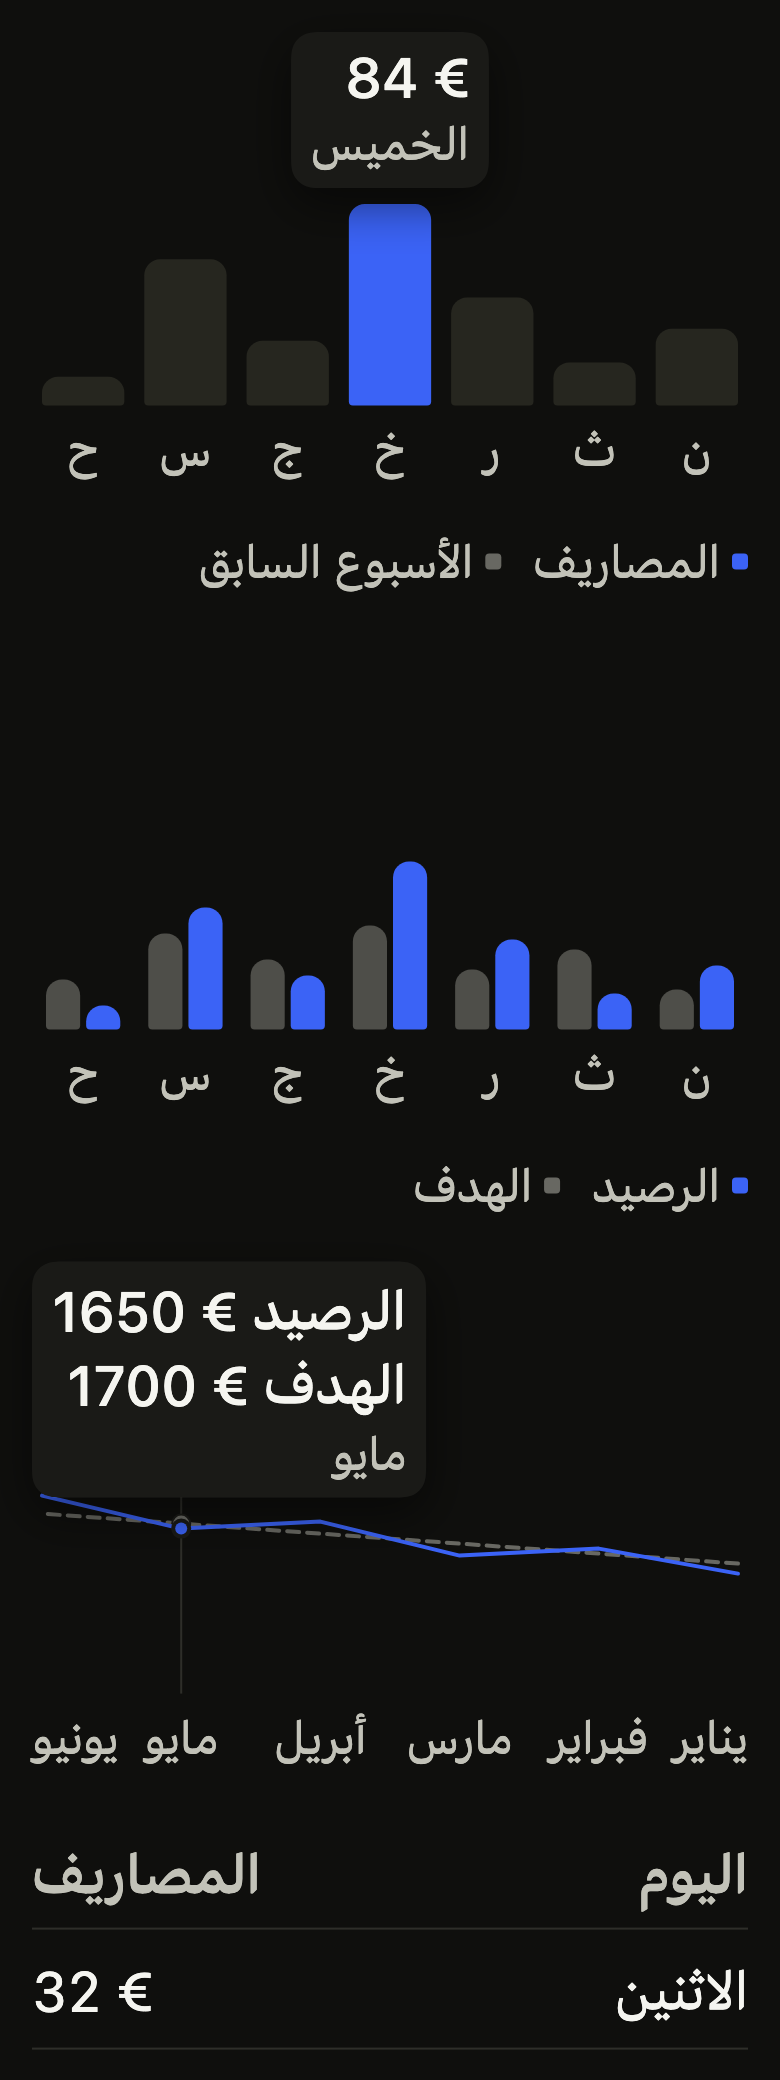
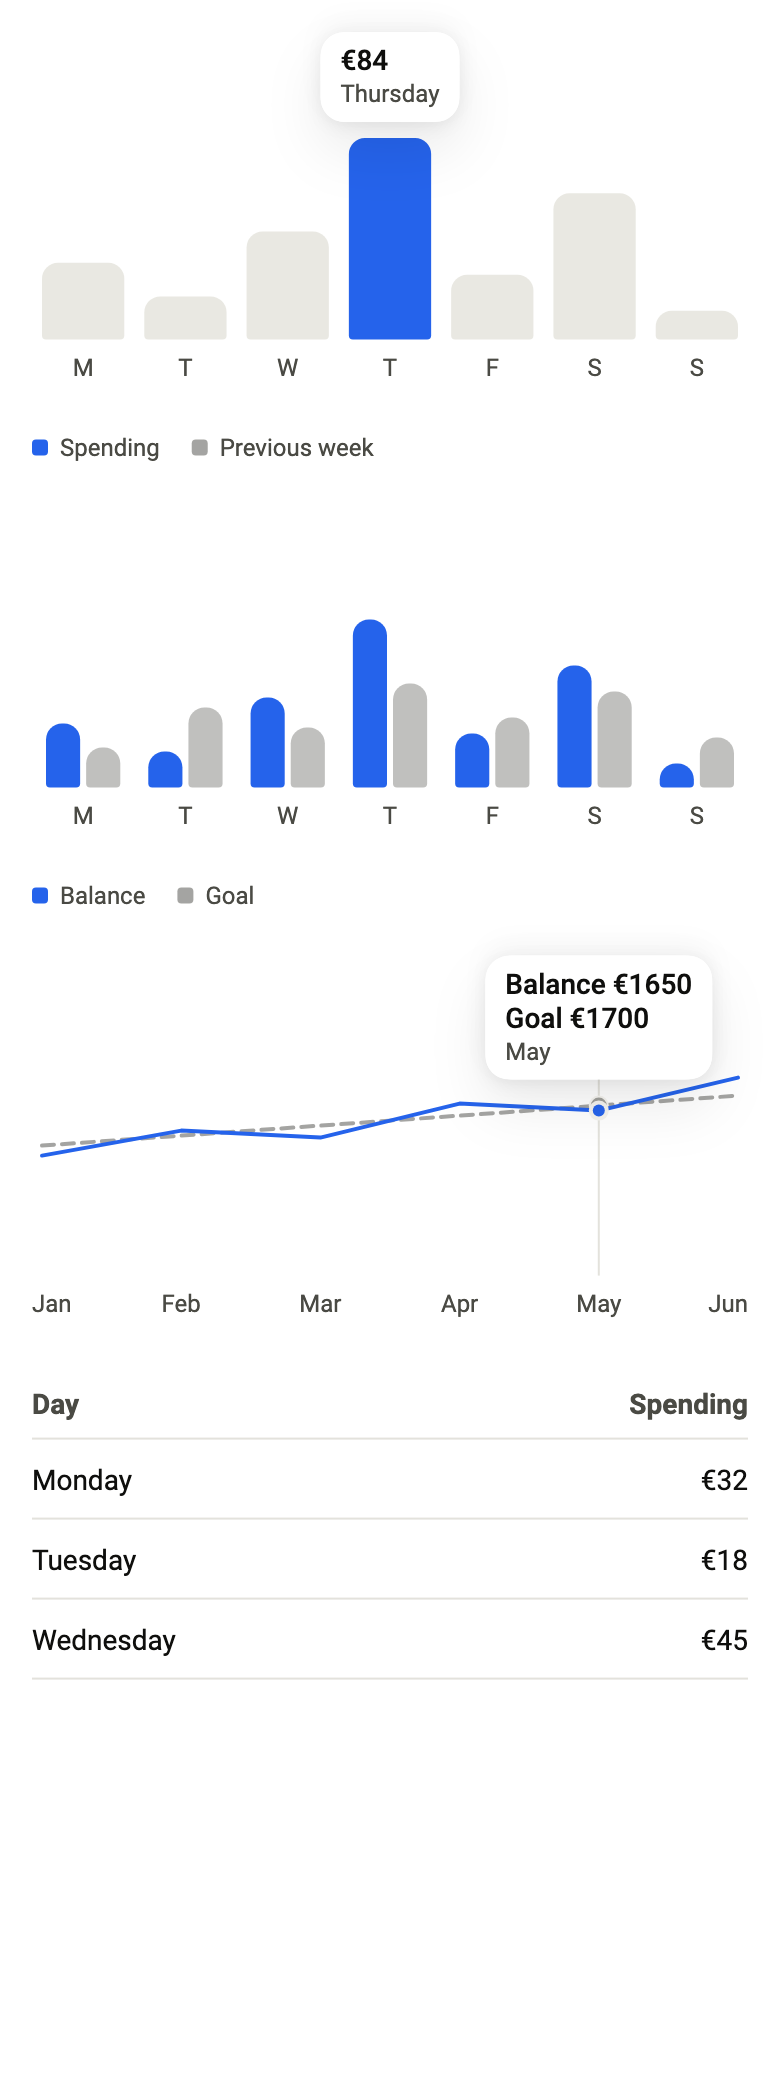
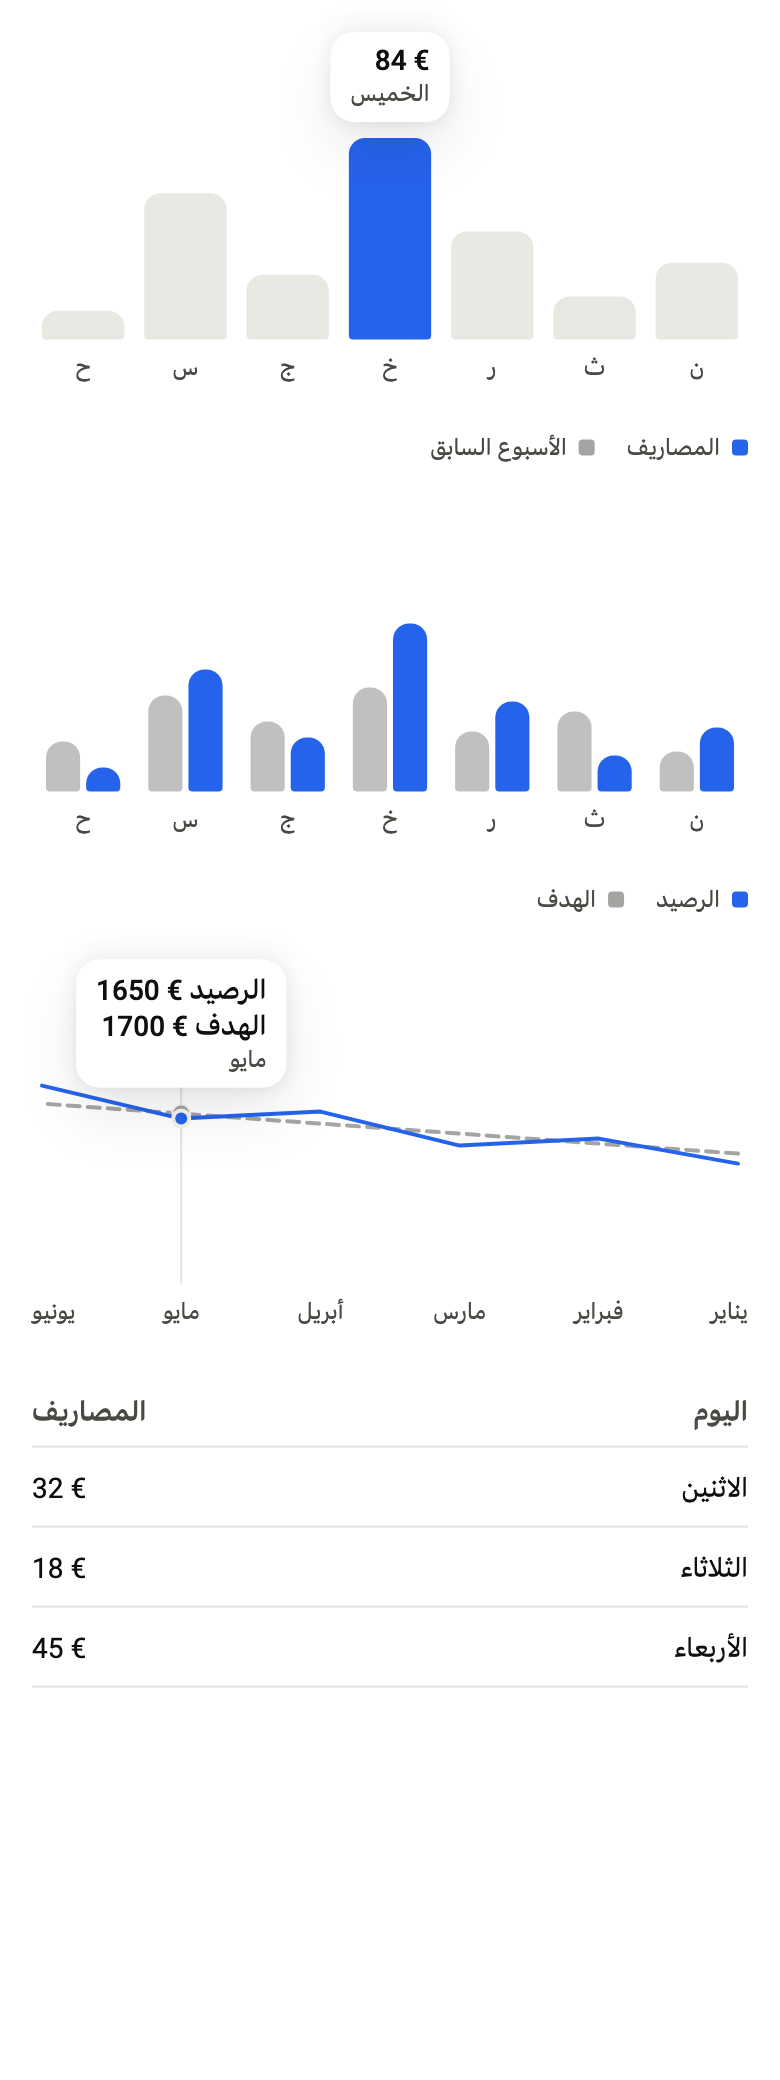
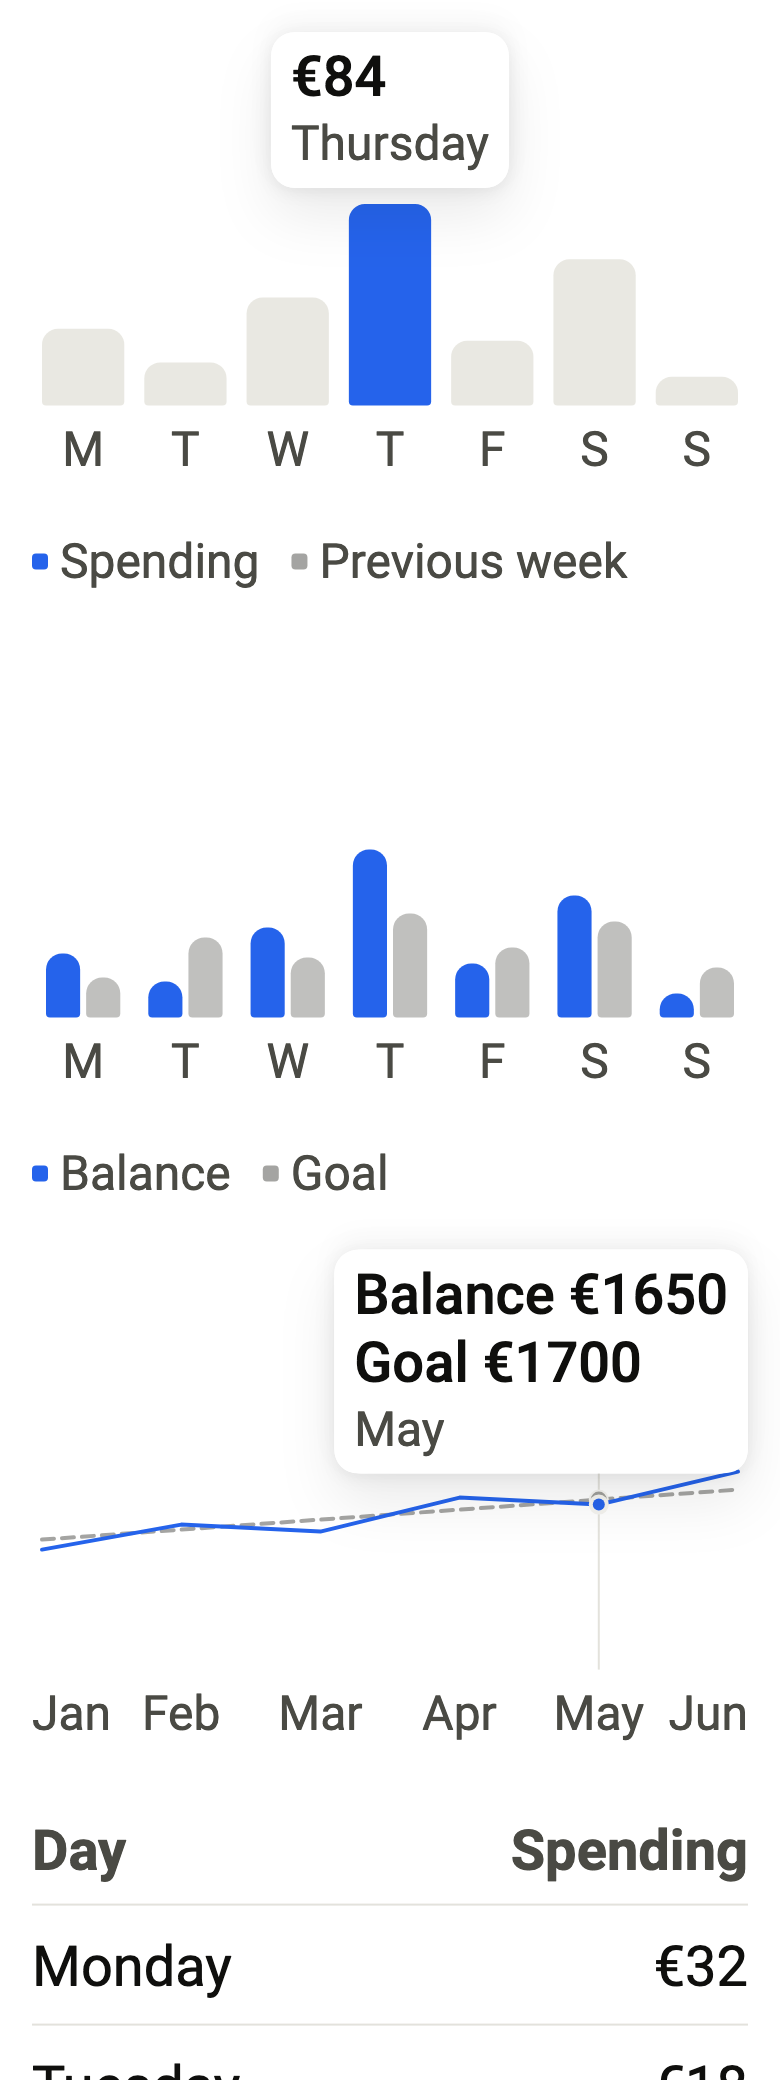
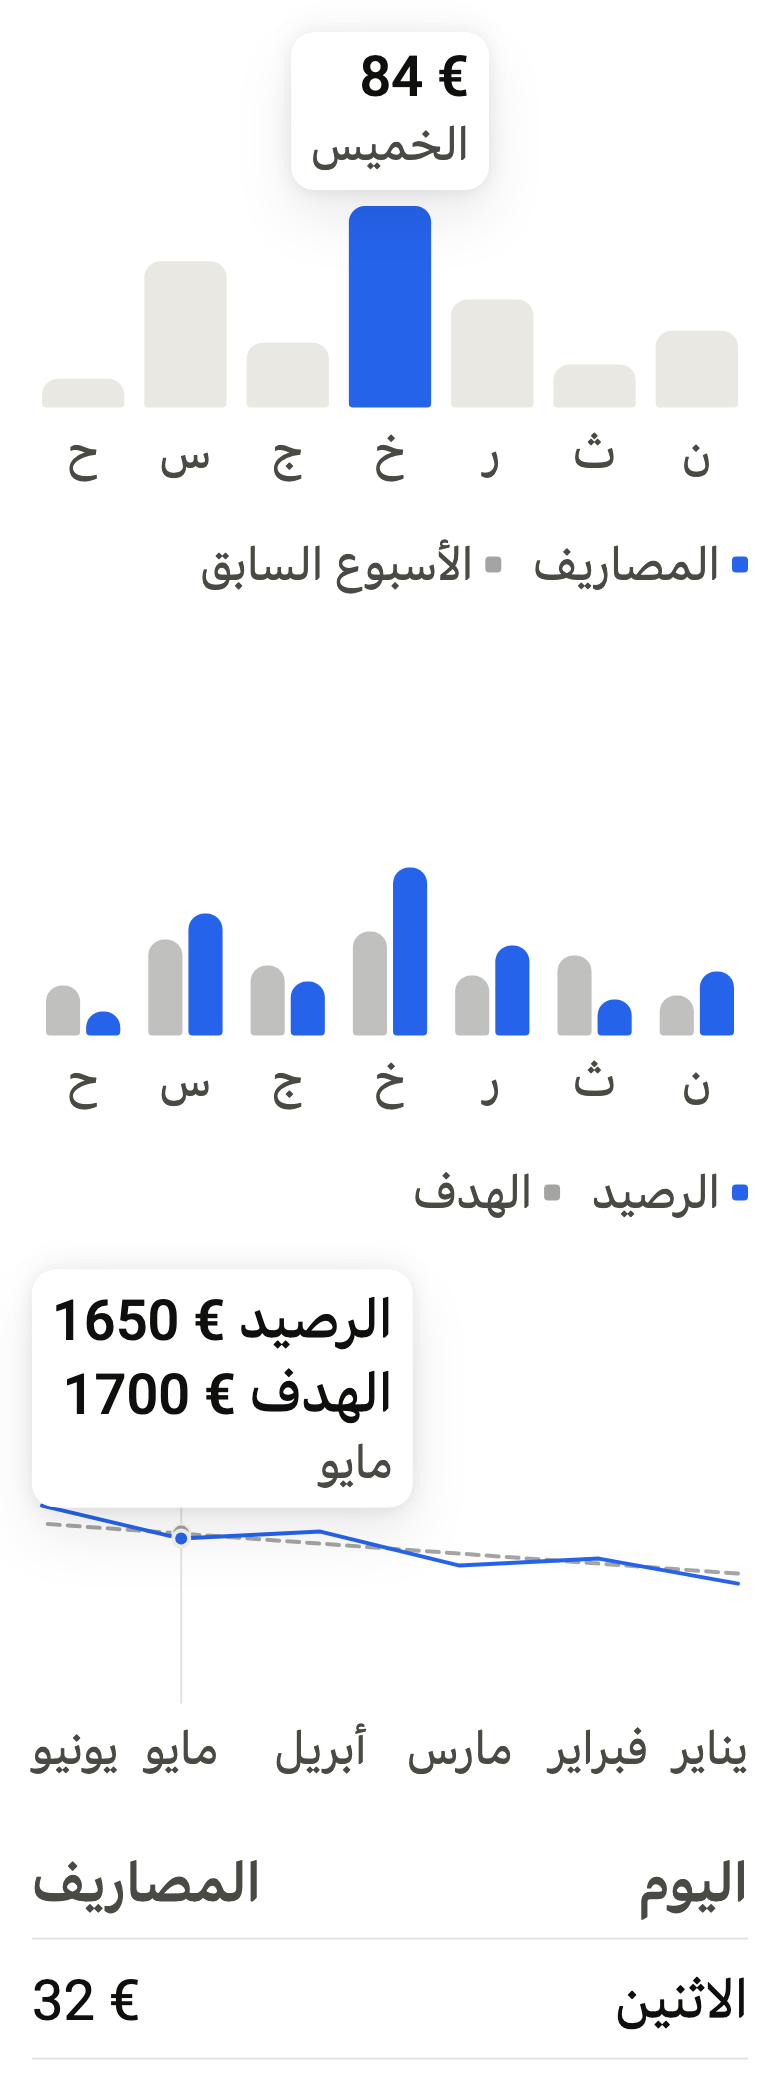
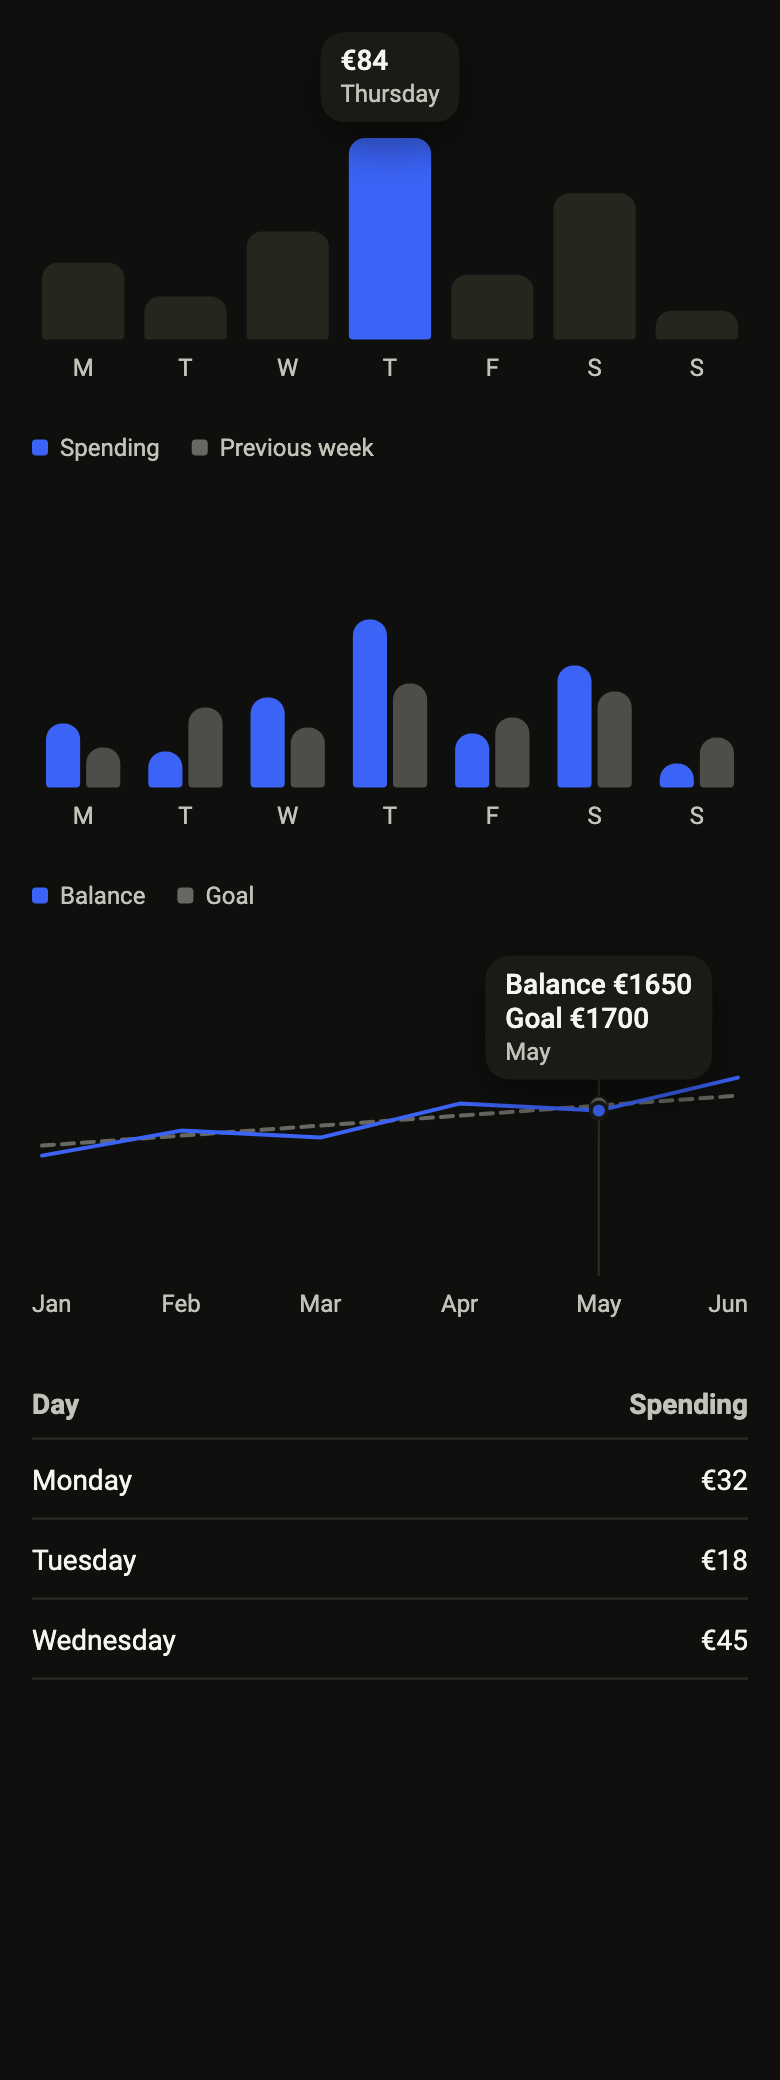
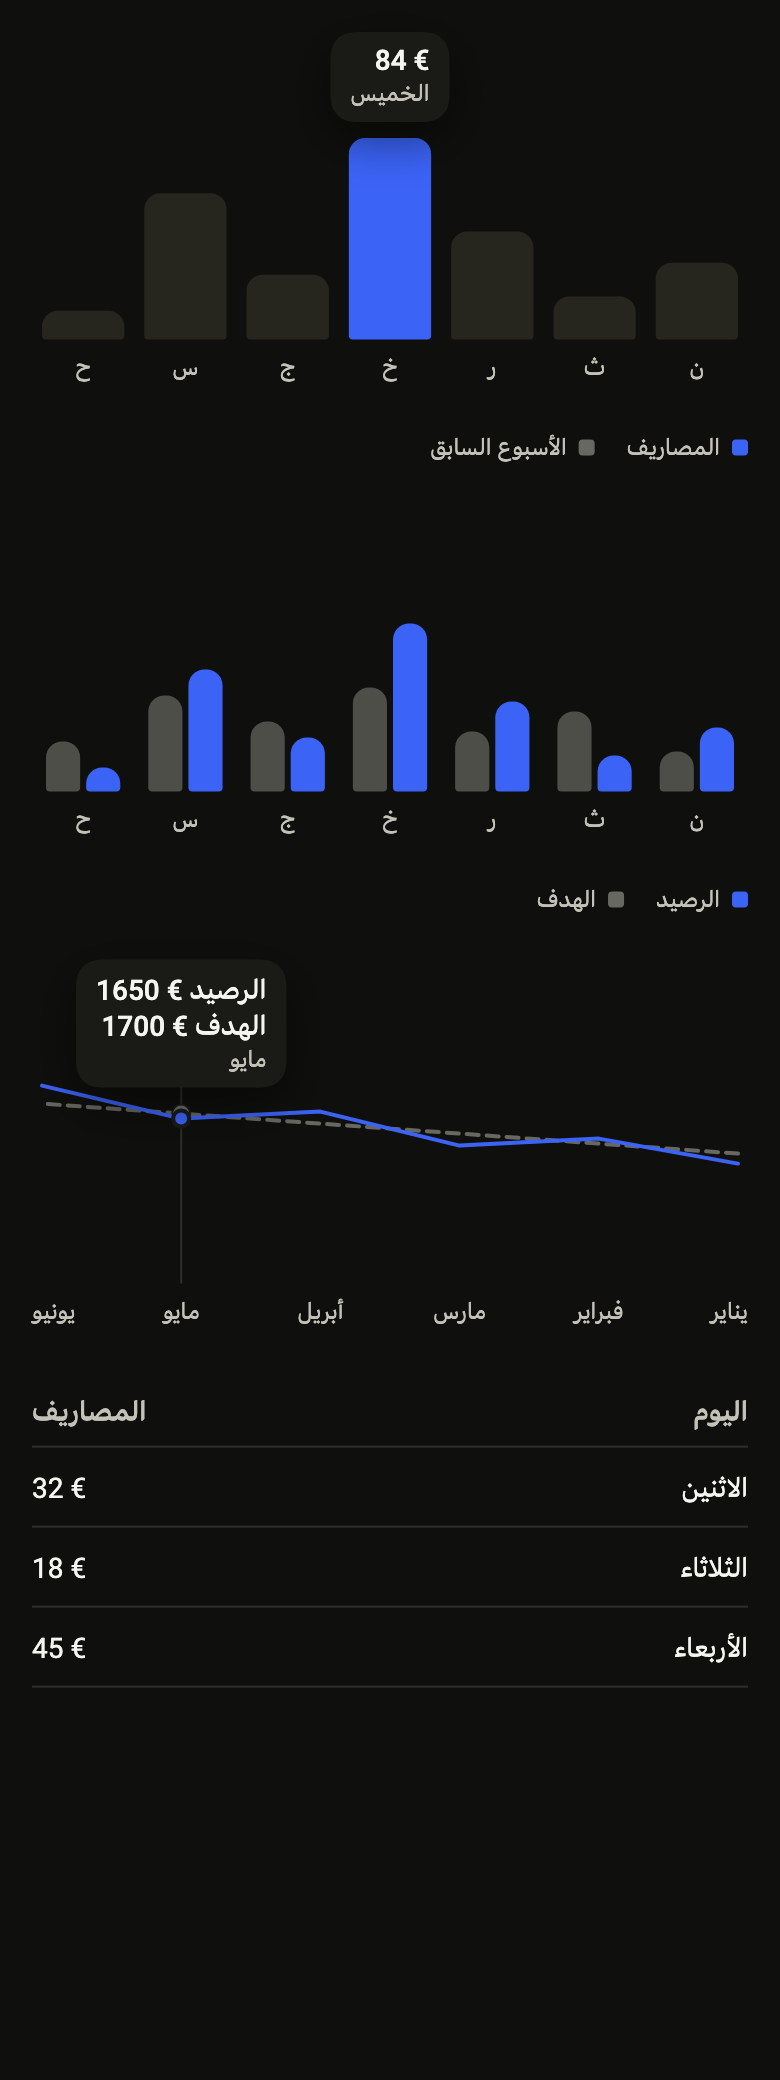
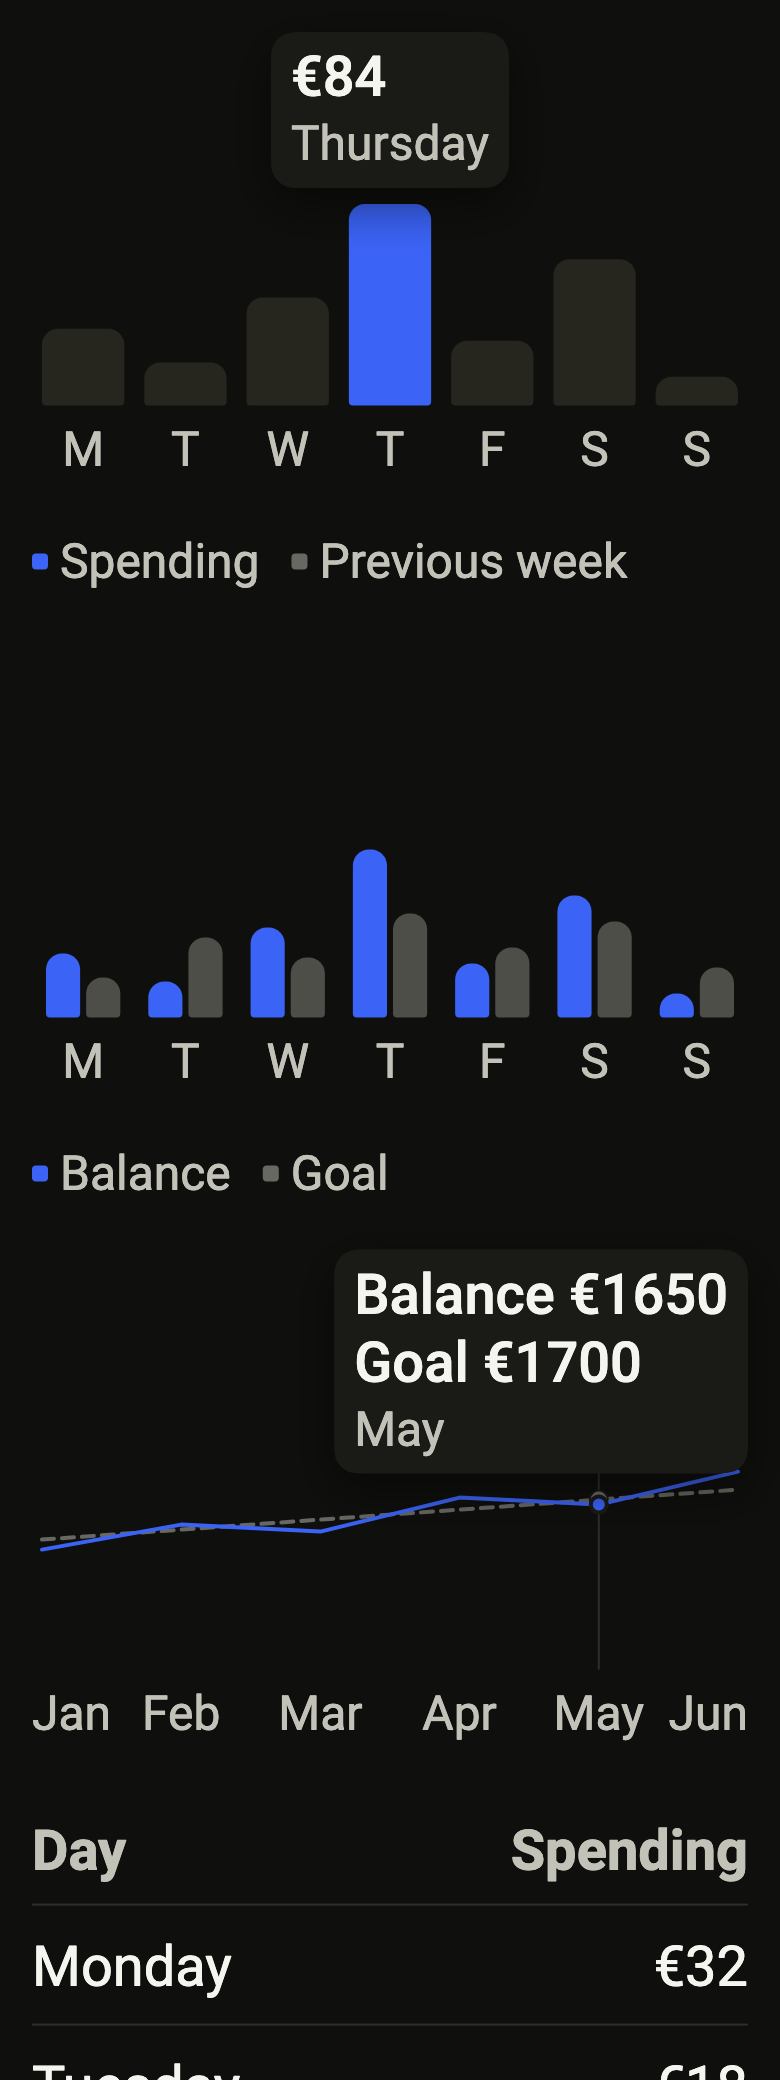
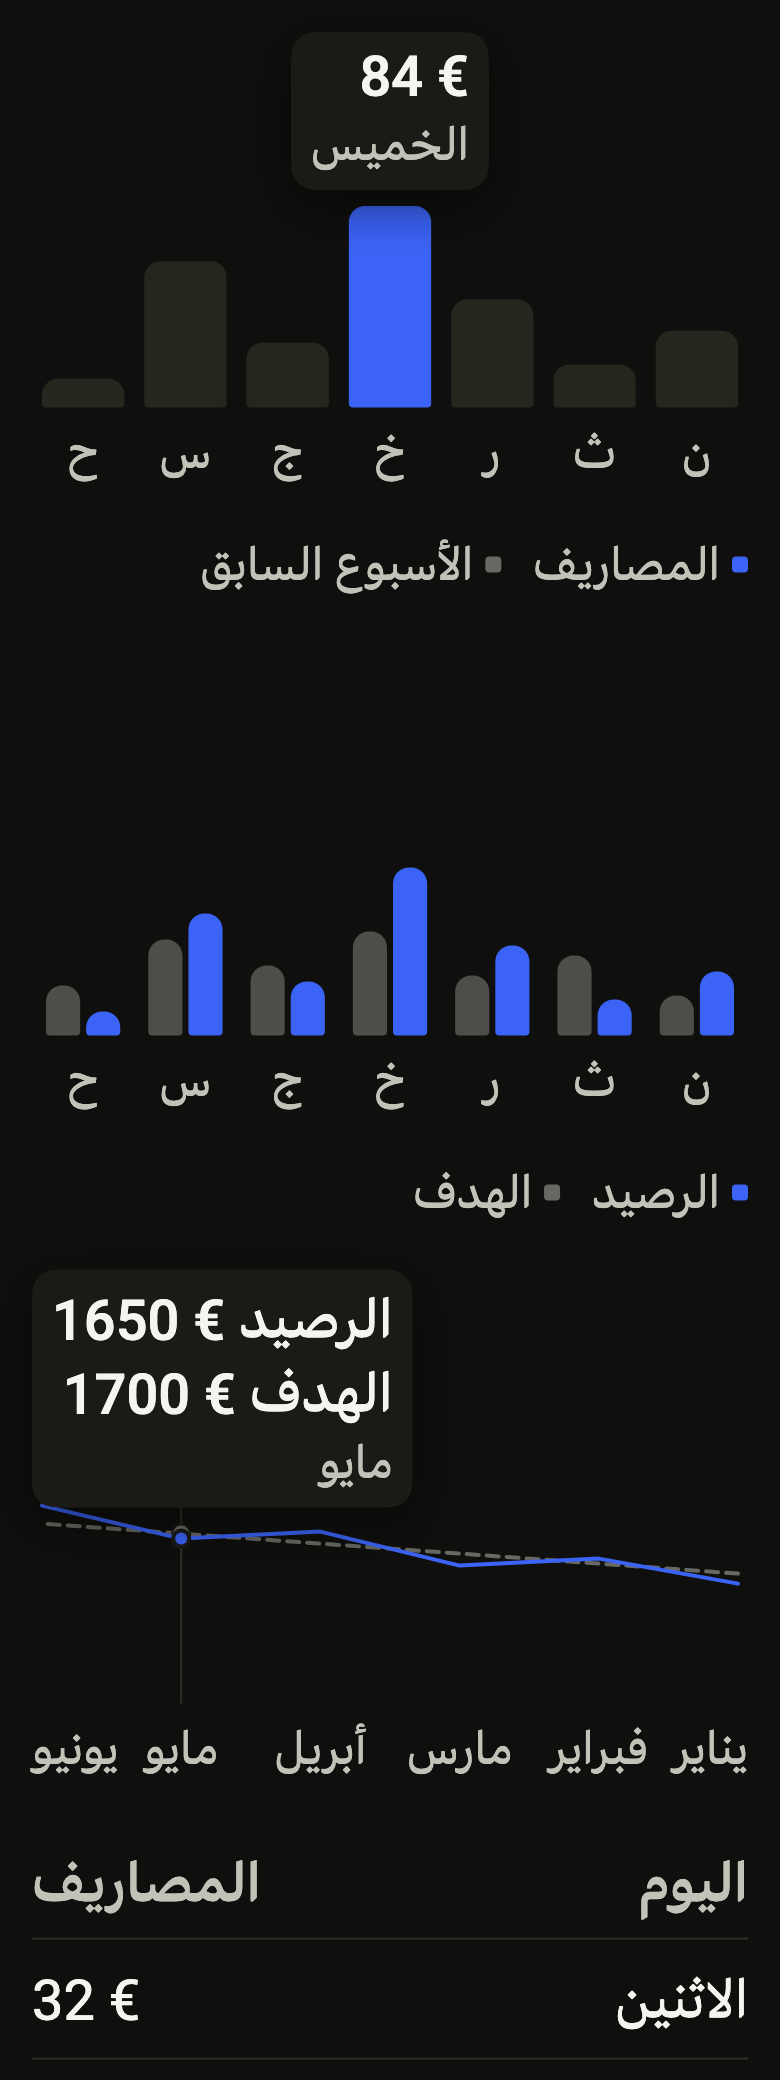
Use it to
- show spending per day of the week as bars
- present how a balance moves over time as a line
- show the amount of a bar under the finger
- offer two series side by side, like this month and the last
- give a spoken summary of the plot to screen readers
- give the same numbers as a table
- Not for
- progress of a task toward a goal: use a progress indicator (progress)
- a single key figure with its change: use a stat card (stat-card)
- picking a day in a date grid: use a calendar (calendar)
- States
Source
The files fliin add chart copies into your app, before your prefix and imports are applied.
chart/fl_chart.dart
import 'dart:math' as math;
import 'dart:ui' as ui;
import 'package:flutter/rendering.dart';
import 'package:flutter/services.dart' show LogicalKeyboardKey;
import 'package:flutter/widgets.dart';
import 'package:fliin_ui/core/fliin.dart';
/// The opacity of the comparison series: its bars (`.chart-bars .b2`), its
/// dashes and its legend mark (`.chart-legend .alt`).
const double _comparisonBarAlpha = 0.35;
const double _comparisonAlpha = 0.5;
/// The opacity of an area under a line, at the top of its fade.
const double _areaAlpha = 0.18;
/// The stroke of a dashed series: a dash of three strokes, a gap of two.
const double _dash = 3;
const double _dashGap = 2;
/// At most four intervals on the value axis, and at least two label lines
/// between two ticks.
const int _maxTicks = 4;
const double _tickSpacing = 2;
/// What the tooltip, the reading and the table write in place of a missing
/// value.
const String _missing = '—';
/// Bars or line.
enum FlChartType {
/// One bar per point, or two side by side: amounts per day or per month.
bar,
/// A line that links the points: a trend, like a balance.
line,
}
/// A point on the time axis: [label], short, under the axis ("T", "12",
/// "Oct"), and [semanticLabel], in full, read by the screen reader, in the
/// tooltip and in the table ("Thursday, October 23").
final class FlChartPoint {
/// A point named [label] on the axis, and [semanticLabel] elsewhere; when
/// null, [label] everywhere.
const FlChartPoint(this.label, {this.semanticLabel});
/// The axis label, short: the axis skips some when they do not fit.
final String label;
/// The point's full label; when null, [label].
final String? semanticLabel;
String get _spoken => semanticLabel ?? label;
}
/// A series: its name ([label], in the legend, the tooltip, the table and
/// the reading) and one value per point, in the order of the points.
final class FlChartSeries {
/// The series [label] of [values].
const FlChartSeries({required this.label, required this.values, this.color});
/// The series' name ("Spending", "Previous week").
final String label;
/// The series' color, from the app's palette (a category, a brand); when
/// null, `selected` for the first series and muted for the second. The
/// second series stays faded, and dashed on a line: it is the comparison.
final Color? color;
/// One value per point. A non-finite value (NaN, infinity) or a missing
/// one, in a list shorter than the points, is a gap: no bar, a broken
/// line, "—" in the tooltip, the reading and the table.
final List<double> values;
/// The value of point [index], null if it is missing or not finite.
double? _at(int index) {
if (index < 0 || index >= values.length) return null;
final value = values[index];
return value.isFinite ? value : null;
}
}
/// A minimal chart, bars or line, of one or two series on a time axis, drawn
/// as the canvas's `.chart-bars`. The data, the labels and the value format
/// come from the app. The drawing reads only tokens: the first series in
/// `selected`, solid; the second in `onSurfaceMuted`, faded, and dashed on a
/// line. Two series carry their legend above the plot. The time axis labels
/// are in muted `textXs`; the value axis and its grid, in `separator`, show
/// only with [showValueAxis].
///
/// Touching or dragging over a point shows its value in a tooltip above the
/// plot; a lone series of bars then fades the other bars to `accentSoft`,
/// and a line marks the point with a stroke. On the keyboard, the chart
/// is one Tab stop: the arrows move from point to point in reading order,
/// Home and End go to the first and the last, Escape removes the tooltip.
/// The screen reader reads [semanticLabel] and [summary], then each point
/// while exploring: its full label and its values. [FlChartTable] gives the
/// same data as a table.
///
/// In RTL, the first point is on the right. The time axis labels skip some
/// when they do not fit, at 2.0 for example. The plot rises from the
/// baseline when it appears and when the data changes, except under
/// reduced motion.
class FlChart extends StatefulWidget {
/// Bars: one per point, two side by side for two series.
const FlChart.bar({
super.key,
required this.points,
required this.series,
required this.formatValue,
this.formatAxis,
this.axisUnit,
required this.semanticLabel,
this.summary,
this.plotHeight = 160,
this.initialSelection,
this.highlight,
this.showValueAxis = false,
this.showTimeAxis = true,
this.tooltip = true,
}) : type = FlChartType.bar,
area = false,
zeroBased = true,
assert(series.length == 1 || series.length == 2, 'one or two series');
/// One line per series, linking the points.
const FlChart.line({
super.key,
required this.points,
required this.series,
required this.formatValue,
this.formatAxis,
this.axisUnit,
required this.semanticLabel,
this.summary,
this.plotHeight = 160,
this.initialSelection,
this.highlight,
this.showValueAxis = false,
this.showTimeAxis = true,
this.tooltip = true,
this.area = false,
this.zeroBased = true,
}) : type = FlChartType.line,
assert(series.length == 1 || series.length == 2, 'one or two series');
/// Bars or line, set by the constructor.
final FlChartType type;
/// The points of the time axis, from oldest to most recent. Without
/// points, the chart is an empty space that keeps its name.
final List<FlChartPoint> points;
/// One or two series, each with one value per point.
final List<FlChartSeries> series;
/// Writes a value in the tooltip, the reading and the table ("€84.00").
final String Function(double value) formatValue;
/// Writes a tick of the value axis ("€50"); when null, [formatValue].
final String Function(double value)? formatAxis;
/// The smallest step that [formatAxis] writes exactly: 1 for a format
/// rounded to the euro. Ticks are then multiples of it, otherwise €2.50
/// would be written "€3". When null, any round tick.
final double? axisUnit;
/// What the chart shows, read first ("Spending this week").
final String semanticLabel;
/// What to take away from it, read after [semanticLabel] ("highest on
/// Thursday, €84").
final String? summary;
/// The plot's height, without the tooltip or the time axis labels.
final double plotHeight;
/// The point whose tooltip is open at the start; when null, or outside
/// the points, none.
final int? initialSelection;
/// The point set apart while nothing is selected (today): the other bars
/// dim, or the line marks it, as under a selection, without a tooltip;
/// when null, none.
final int? highlight;
/// True: the value axis, its ticks written by [formatAxis] at the start
/// of the plot and its grid across it. False by default, as in the canvas:
/// the ticks only set the scale.
final bool showValueAxis;
/// False: no time axis labels under the plot, for a sparkline in a card
/// (`FlStatCard.footer`). The points keep their full label for the
/// tooltip and the screen reader.
final bool showTimeAxis;
/// False: a touched point is marked without a tooltip, and the chart
/// keeps no room above the plot for one: a sparkline whose figure is
/// written next to it. The screen reader still reads each point.
final bool tooltip;
/// True: the first line fills the space under it, fading toward the
/// bottom of the plot (an area chart). Bars never do.
final bool area;
/// False: a line's scale fits its values instead of starting at zero, so
/// that a balance moving between €1,500 and €1,700 shows its moves. Bars
/// always start at zero: their height is their value.
final bool zeroBased;
@override
State<FlChart> createState() => _FlChartState();
}
class _FlChartState extends State<FlChart> with SingleTickerProviderStateMixin {
late final AnimationController _entrance = AnimationController(vsync: this);
int? _selected;
bool _focused = false;
/// The geometry of the last build, kept as long as nothing changes it: a
/// drag does not remeasure every label.
_ChartLayout? _layout;
@override
void initState() {
super.initState();
final initial = widget.initialSelection;
_selected = initial != null && initial >= 0 && initial < widget.points.length ? initial : null;
}
@override
void didChangeDependencies() {
super.didChangeDependencies();
if (_entrance.value == 0 && !_entrance.isAnimating) _enter();
}
@override
void didUpdateWidget(FlChart oldWidget) {
super.didUpdateWidget(oldWidget);
if (!_sameData(oldWidget, widget)) {
_selected = null;
_entrance.value = 0;
_enter();
}
}
static bool _sameData(FlChart a, FlChart b) =>
a.type == b.type &&
a.points.length == b.points.length &&
a.series.length == b.series.length &&
[for (var i = 0; i < a.points.length; i++) a.points[i].label == b.points[i].label].every((same) => same) &&
[
for (var s = 0; s < a.series.length; s++)
for (var i = 0; i < a.points.length; i++) a.series[s]._at(i) == b.series[s]._at(i),
].every((same) => same);
void _enter() {
final motion = FlMotion.of(context);
if (motion.reduced) {
_entrance.value = 1;
} else {
_entrance.driveTo(1, motion.spring(FlSpring.spatialSlow));
}
}
@override
void dispose() {
_entrance.dispose();
super.dispose();
}
void _select(int? index) {
if (index != _selected) setState(() => _selected = index);
}
@override
Widget build(BuildContext context) {
final theme = FlScope.of(context);
if (widget.points.isEmpty) {
return Semantics(
container: true,
label: widget.semanticLabel,
child: SizedBox(height: widget.plotHeight),
);
}
final colors = theme.colors;
final dir = Directionality.of(context);
final scaler = MediaQuery.textScalerOf(context);
final count = widget.points.length;
final forward = dir == TextDirection.rtl ? -1 : 1;
final summary = widget.summary;
final plot = LayoutBuilder(
builder: (context, constraints) {
final inherited = DefaultTextStyle.of(context).style;
final kept = _layout;
final layout = kept != null && kept.fits(constraints.maxWidth, theme, scaler, inherited, dir, widget)
? kept
: _layout = _ChartLayout(
width: constraints.maxWidth,
theme: theme,
scaler: scaler,
inherited: inherited,
dir: dir,
chart: widget,
);
final selected = _selected;
final highlight = widget.highlight;
final marked = selected ?? (highlight != null && highlight >= 0 && highlight < count ? highlight : null);
return GestureDetector(
behavior: HitTestBehavior.opaque,
excludeFromSemantics: true,
onTapUp: (details) {
final index = layout.indexAt(details.localPosition.dx);
_select(index == _selected ? null : index);
},
onHorizontalDragStart: (details) => _select(layout.indexAt(details.localPosition.dx)),
onHorizontalDragUpdate: (details) => _select(layout.indexAt(details.localPosition.dx)),
child: SizedBox(
width: layout.width,
height: layout.height,
child: Stack(
children: [
Positioned.fill(
child: CustomPaint(
painter: _ChartPainter(
layout: layout,
chart: widget,
entrance: _entrance,
selected: marked,
lead: colors.selected,
dim: colors.accentSoft,
muted: colors.onSurfaceMuted,
grid: colors.separator,
baseline: colors.border,
gap: theme.space.xs,
surface: colors.surfaceRaised,
stroke: theme.size.indicatorStroke,
hairline: theme.size.border,
radius: theme.shape.radiusSm,
),
),
),
if (selected != null && widget.tooltip)
PositionedDirectional(
top: 0,
start: 0,
end: 0,
height: layout.bubbleBottoms[selected],
child: CustomSingleChildLayout(
delegate: _BubblePosition(layout.center(selected)),
child: _Bubble(chart: widget, index: selected),
),
),
],
),
),
);
},
);
return Semantics(
container: true,
explicitChildNodes: true,
label: summary == null ? widget.semanticLabel : '${widget.semanticLabel}, $summary',
child: FocusableActionDetector(
mouseCursor: SystemMouseCursors.click,
shortcuts: {
const SingleActivator(LogicalKeyboardKey.arrowRight): _StepIntent(forward),
const SingleActivator(LogicalKeyboardKey.arrowLeft): _StepIntent(-forward),
const SingleActivator(LogicalKeyboardKey.home): const _EdgeIntent(end: false),
const SingleActivator(LogicalKeyboardKey.end): const _EdgeIntent(end: true),
const SingleActivator(LogicalKeyboardKey.escape): const _ClearIntent(),
},
// A key that would change nothing is not consumed: it bubbles up to
// the page.
actions: {
_StepIntent: _ChartAction<_StepIntent>(
to: (intent) => switch (_selected) {
null => intent.step > 0 ? 0 : count - 1,
final at => at + intent.step,
},
count: count,
selected: _selected,
select: _select,
),
_EdgeIntent: _ChartAction<_EdgeIntent>(
to: (intent) => intent.end ? count - 1 : 0,
count: count,
selected: _selected,
select: _select,
),
_ClearIntent: _ChartAction<_ClearIntent>(to: (_) => null, count: count, selected: _selected, select: _select),
},
onShowFocusHighlight: (visible) => setState(() => _focused = visible),
child: Column(
mainAxisSize: MainAxisSize.min,
crossAxisAlignment: CrossAxisAlignment.stretch,
spacing: theme.space.sm,
children: [
if (widget.series.length == 2) _Legend(chart: widget),
FlFocusRing(visible: _focused, borderRadius: BorderRadius.circular(theme.shape.radiusSm), child: plot),
],
),
),
);
}
}
/// The geometry of a chart at a given width: ticks, room for the labels,
/// the plot and the tooltip, center of each point.
final class _ChartLayout {
_ChartLayout({
required this.width,
required this.theme,
required this.scaler,
required this.inherited,
required this.dir,
required this.chart,
}) : count = chart.points.length {
// A TextPainter does not inherit DefaultTextStyle: the app's font and
// its fallback fonts are given to it, as to a Text.
final style = inherited
.merge(theme.typography.resolve(FlTextRole.textXs))
.copyWith(color: theme.colors.onSurfaceMuted);
final strut = theme.typography.strut(FlTextRole.textXs, inheritedFamily: inherited.fontFamily);
TextPainter measure(String text) => TextPainter(
text: TextSpan(text: text, style: style),
strutStyle: strut,
textDirection: dir,
textScaler: scaler,
)..layout();
final line = measure('0').height;
final values = [
for (final s in chart.series)
for (var i = 0; i < count; i++) ?s._at(i),
];
final origin = chart.zeroBased || values.isEmpty ? 0.0 : values.first;
final lo = values.fold(origin, math.min);
final hi = values.fold(origin, math.max);
final intervals = (chart.plotHeight / (line * _tickSpacing)).floor().clamp(1, _maxTicks);
// A line fitted to its values without a value axis spans them exactly:
// round ticks would only widen it, flattening a short plot.
ticks = !chart.zeroBased && !chart.showValueAxis && hi > lo
? [lo, hi]
: _niceTicks(lo, hi, intervals, chart.axisUnit);
min = ticks.first;
max = ticks.last == ticks.first ? ticks.first + 1 : ticks.last;
final axis = chart.formatAxis ?? chart.formatValue;
yLabels = [for (final tick in ticks) measure(axis(tick))];
final yWidth = chart.showValueAxis ? yLabels.map((p) => p.width).reduce(math.max) : 0.0;
xLabels = [for (final point in chart.points) measure(point.label)];
// The canvas's `.chart-tip` stands `space.sm` above its point and may
// overlap the plot's empty top: the band above the plot is only the
// room that the tallest tooltip lacks there, over all points, at the
// chart's width. A two-line label at 2.0 fits, and the plot does not
// move when a tooltip opens.
final bubbleText = math.max(0.0, width - 2 * theme.space.md);
final lift = theme.space.sm + (chart.type == FlChartType.line ? theme.size.indicatorStroke * 2.5 : 0);
final span = max - min;
var band = 0.0;
final headroom = <double>[];
final bubbles = <double>[];
for (var i = 0; i < count; i++) {
final painter = TextPainter(
text: _bubbleSpan(chart, i, inherited.merge(theme.typography.resolve(FlTextRole.textXs)), theme),
strutStyle: strut,
textDirection: dir,
textScaler: scaler,
)..layout(maxWidth: bubbleText);
final bubble = painter.height + theme.space.xs * 3;
painter.dispose();
final peak = [for (final s in chart.series) ?s._at(i)].fold(0.0, math.max).clamp(min, max);
final room = (max - peak) / span * chart.plotHeight - lift;
headroom.add(room);
bubbles.add(bubble);
if (chart.tooltip) band = math.max(band, bubble - room);
}
this.band = band;
bubbleBottoms = [for (var i = 0; i < count; i++) math.max(bubbles[i], band + headroom[i])];
top = band;
bottom = band + chart.plotHeight;
final gap = chart.showValueAxis ? theme.space.sm : 0.0;
final plotWidth = math.max(0.0, width - yWidth - gap);
plotStart = dir == TextDirection.ltr ? yWidth + gap : 0;
plotEnd = plotStart + plotWidth;
yLabelEdge = dir == TextDirection.ltr ? yWidth : plotEnd + gap;
slot = plotWidth / count;
// The ring of a selected point stays inside the chart.
inset = _edgeToEdge ? theme.size.indicatorStroke * 2.5 : 0;
step = _edgeToEdge ? math.max(0.0, plotWidth - 2 * inset) / (count - 1) : slot;
xLabelTop = bottom + theme.space.xs * 1.5;
height = chart.showTimeAxis ? xLabelTop + line : bottom;
final widest = xLabels.map((p) => p.width).reduce(math.max);
labelStep = step <= 0 ? count : math.max(1, ((widest + theme.space.sm) / step).ceil());
}
final double width;
final FlTheme theme;
final TextScaler scaler;
final TextStyle inherited;
final TextDirection dir;
final FlChart chart;
final int count;
late final List<double> ticks;
late final double min;
late final double max;
late final List<TextPainter> yLabels;
late final List<TextPainter> xLabels;
late final double band;
/// Where each point's tooltip ends, from the top: `space.sm` above its
/// highest value (and the ring of a line's point), never above the top.
late final List<double> bubbleBottoms;
late final double top;
late final double bottom;
late final double plotStart;
late final double plotEnd;
/// The ticks' edge on the plot side: their right edge in LTR, their left
/// edge in RTL.
late final double yLabelEdge;
late final double slot;
/// The distance between two points' centers.
late final double step;
/// A line's margin at each end of the plot.
late final double inset;
bool get _edgeToEdge => chart.type == FlChartType.line && count > 1;
late final double xLabelTop;
late final double height;
/// One time axis label every [labelStep].
late final int labelStep;
/// True if this geometry still holds for these inputs.
bool fits(double width, FlTheme theme, TextScaler scaler, TextStyle inherited, TextDirection dir, FlChart chart) =>
width == this.width &&
identical(chart, this.chart) &&
theme == this.theme &&
scaler == this.scaler &&
inherited == this.inherited &&
dir == this.dir;
/// The center of point [index], the first at the start of the line. A
/// bar stands in the middle of its cell; a line runs from one edge of the
/// plot to the other, as the canvas's `.chart-x` spreads its labels.
double center(int index) {
final along = _edgeToEdge ? inset + index * step : (index + 0.5) * slot;
return dir == TextDirection.ltr ? plotStart + along : plotEnd - along;
}
/// The cell of point [index], top to bottom, centered on it.
Rect slotRect(int index) {
final x = center(index);
final left = math.max(plotStart, x - step / 2);
final right = math.min(plotEnd, x + step / 2);
return Rect.fromLTRB(left, 0, math.max(left, right), height);
}
/// The height of [value] in the plot.
double y(double value) => bottom - (value - min) / (max - min) * (bottom - top);
/// The point closest to [dx].
int indexAt(double dx) {
final along = dir == TextDirection.ltr ? dx - plotStart : plotEnd - dx;
if (_edgeToEdge) {
return step <= 0 ? 0 : ((along - inset) / step).round().clamp(0, count - 1);
}
return (along / slot).floor().clamp(0, count - 1);
}
}
/// Round ticks (1, 2, 2.5 or 5 times a power of ten) that cover [lo] to
/// [hi] in at most [intervals] intervals, zero included. With [unit], the
/// step is a multiple of it.
List<double> _niceTicks(double lo, double hi, int intervals, double? unit) {
if (hi == lo) return [lo];
final rough = (hi - lo) / intervals;
bool fitsUnit(double step) {
if (unit == null || unit <= 0) return true;
final ratio = step / unit;
return ratio >= 1 - 1e-9 && (ratio - ratio.round()).abs() < 1e-9;
}
var magnitude = math.pow(10, (math.log(rough) / math.ln10).floor()).toDouble();
double? step;
while (step == null) {
for (final f in const [1.0, 2.0, 2.5, 5.0]) {
final candidate = f * magnitude;
if (candidate >= rough && fitsUnit(candidate)) {
step = candidate;
break;
}
}
magnitude *= 10;
}
final first = (lo / step).floor();
final last = (hi / step).ceil();
return [for (var i = first; i <= last; i++) i * step];
}
class _ChartPainter extends CustomPainter {
_ChartPainter({
required this.layout,
required this.chart,
required this.entrance,
required this.selected,
required this.lead,
required this.dim,
required this.muted,
required this.grid,
required this.baseline,
required this.gap,
required this.surface,
required this.stroke,
required this.hairline,
required this.radius,
}) : super(repaint: entrance);
final _ChartLayout layout;
final FlChart chart;
final Animation<double> entrance;
final int? selected;
/// The first series.
final Color lead;
/// The bars that a selection leaves aside, on a lone series.
final Color dim;
final Color muted;
final Color grid;
final Color baseline;
/// `space.xs`: the bars' spacing derives from it.
final double gap;
/// The background under the chart: the ring of a selected point.
final Color surface;
final double stroke;
final double hairline;
final double radius;
@override
void paint(Canvas canvas, Size size) {
final l = layout;
final rtl = l.dir == TextDirection.rtl;
for (final (i, tick) in chart.showValueAxis ? l.ticks.indexed : const <(int, double)>[]) {
final y = l.y(tick);
canvas.drawLine(
Offset(l.plotStart, y),
Offset(l.plotEnd, y),
Paint()
..color = tick == 0 ? baseline : grid
..strokeWidth = hairline,
);
final label = l.yLabels[i];
final x = rtl ? l.yLabelEdge : l.yLabelEdge - label.width;
label.paint(canvas, Offset(x, y - label.height / 2));
}
for (var i = 0; chart.showTimeAxis && i < l.count; i += l.labelStep) {
final label = l.xLabels[i];
// A line's first and last labels end at the plot's edges.
final (lo, hi) = chart.type == FlChartType.line ? (l.plotStart, l.plotEnd) : (0.0, l.width);
final x = (l.center(i) - label.width / 2).clamp(lo, math.max(lo, hi - label.width)).toDouble();
label.paint(canvas, Offset(x, l.xLabelTop));
}
final selected = this.selected;
if (selected != null && chart.type == FlChartType.line) {
final x = l.center(selected);
canvas.drawLine(
Offset(x, l.top),
Offset(x, l.bottom),
Paint()
..color = grid
..strokeWidth = hairline,
);
}
final t = entrance.value;
final zero = l.y(0.0.clamp(l.min, l.max));
double at(double value) => zero + (l.y(value) - zero) * t;
switch (chart.type) {
case FlChartType.bar:
_bars(canvas, zero, at, selected);
case FlChartType.line:
_lines(canvas, at, selected);
}
}
/// `.chart-bars`: 10 between two bars, 14 between two pairs whose bars
/// stand 3 apart; corners of `radiusSm` at the top, a quarter of it at the
/// foot.
void _bars(Canvas canvas, double zero, double Function(double value) at, int? selected) {
final l = layout;
final k = chart.series.length;
final inner = gap * 0.75;
final group = math.max(0.0, l.slot - (k == 1 ? gap * 2.5 : gap * 3.5));
final width = (group - inner * (k - 1)) / k;
for (var i = 0; i < l.count; i++) {
for (var s = 0; s < k; s++) {
final offset = -group / 2 + s * (width + inner);
final start = l.dir == TextDirection.ltr ? l.center(i) + offset : l.center(i) - offset - width;
final value = chart.series[s]._at(i);
if (value == null) continue;
final y = at(value);
final rect = Rect.fromLTRB(start, math.min(y, zero), start + width, math.max(y, zero));
if (rect.height <= 0 || rect.width <= 0) continue;
final r = Radius.circular(math.min(radius, math.min(width / 2, rect.height)));
final foot = Radius.circular(math.min(radius / 4, math.min(width / 2, rect.height)));
final up = y <= zero;
final shape = RRect.fromRectAndCorners(
rect,
topLeft: up ? r : foot,
topRight: up ? r : foot,
bottomLeft: up ? foot : r,
bottomRight: up ? foot : r,
);
final own = chart.series[s].color;
final color = s == 0
? (k == 1 && selected != null && selected != i
? (own == null ? dim : own.withValues(alpha: own.a * _comparisonBarAlpha))
: own ?? lead)
: (own ?? muted).withValues(alpha: (own ?? muted).a * _comparisonBarAlpha);
canvas.drawRRect(shape, Paint()..color = color);
}
}
}
void _lines(Canvas canvas, double Function(double value) at, int? selected) {
final l = layout;
for (var s = chart.series.length - 1; s >= 0; s--) {
final series = chart.series[s];
final own = series.color;
final color = s == 0 ? own ?? lead : (own ?? muted).withValues(alpha: (own ?? muted).a * _comparisonAlpha);
final paint = Paint()
..color = color
..style = PaintingStyle.stroke
..strokeWidth = stroke
..strokeCap = StrokeCap.round
..strokeJoin = StrokeJoin.round;
// A missing value breaks the line; a lone point between two gaps is a
// disc.
final path = Path();
for (var i = 0; i < l.count; i++) {
final value = series._at(i);
if (value == null) continue;
final point = Offset(l.center(i), at(value));
if (series._at(i - 1) == null) {
if (series._at(i + 1) == null) {
canvas.drawCircle(point, stroke, Paint()..color = color);
}
path.moveTo(point.dx, point.dy);
} else {
path.lineTo(point.dx, point.dy);
}
}
if (s == 0 && chart.area) _area(canvas, series, at, color);
canvas.drawPath(s == 0 ? path : _dashed(path), paint);
final picked = selected == null ? null : series._at(selected);
if (selected != null && picked != null) {
final point = Offset(l.center(selected), at(picked));
canvas.drawCircle(point, stroke * 2.5, Paint()..color = surface);
canvas.drawCircle(point, stroke * 1.5, s == 0 ? (Paint()..color = color) : paint);
}
}
}
/// The area under each unbroken run of [series], down to the bottom of
/// the plot, in [color] fading out toward it.
void _area(Canvas canvas, FlChartSeries series, double Function(double value) at, Color color) {
final l = layout;
final fill = Path();
var open = false;
for (var i = 0; i <= l.count; i++) {
final value = i < l.count ? series._at(i) : null;
if (value != null) {
final point = Offset(l.center(i), at(value));
if (!open) {
open = true;
fill.moveTo(point.dx, l.bottom);
}
fill.lineTo(point.dx, point.dy);
} else if (open) {
fill
..lineTo(l.center(i - 1), l.bottom)
..close();
open = false;
}
}
canvas.drawPath(
fill,
Paint()
..shader = ui.Gradient.linear(Offset(0, l.top), Offset(0, l.bottom), [
color.withValues(alpha: color.a * _areaAlpha),
color.withValues(alpha: 0),
]),
);
}
Path _dashed(Path source) {
final dashed = Path();
for (final metric in source.computeMetrics()) {
var distance = 0.0;
while (distance < metric.length) {
dashed.addPath(metric.extractPath(distance, distance + stroke * _dash), Offset.zero);
distance += stroke * (_dash + _dashGap);
}
}
return dashed;
}
@override
SemanticsBuilderCallback get semanticsBuilder =>
(size) => [
for (var i = 0; i < layout.count; i++)
CustomPainterSemantics(
key: ValueKey<int>(i),
rect: layout.slotRect(i),
properties: SemanticsProperties(
label: chart.points[i]._spoken,
value: _valuesOf(chart, i),
textDirection: layout.dir,
sortKey: OrdinalSortKey(i.toDouble()),
),
),
];
@override
bool shouldRepaint(_ChartPainter old) =>
old.layout != layout ||
old.chart != chart ||
old.selected != selected ||
old.lead != lead ||
old.dim != dim ||
old.muted != muted ||
old.grid != grid ||
old.baseline != baseline ||
old.gap != gap ||
old.surface != surface ||
old.stroke != stroke ||
old.hairline != hairline ||
old.radius != radius;
@override
bool shouldRebuildSemantics(_ChartPainter old) => old.layout != layout || old.chart != chart;
}
/// The value of point [index] of [series], written by [format], or "—".
String _written(FlChartSeries series, int index, String Function(double value) format) {
final value = series._at(index);
return value == null ? _missing : format(value);
}
/// The values of point [index]: alone, the value; with two series, each
/// preceded by its name.
String _valuesOf(FlChart chart, int index) => chart.series.length == 1
? _written(chart.series.single, index, chart.formatValue)
: [for (final s in chart.series) '${s.label} ${_written(s, index, chart.formatValue)}'].join(', ');
/// The tooltip text of point [index], as the canvas's `.chart-tip`: one
/// line per series in medium `textSm`, then its full label in muted
/// `textXs`. The tooltip shows it, and the geometry measures it.
TextSpan _bubbleSpan(FlChart chart, int index, TextStyle style, FlTheme theme) {
final scale = theme.typography;
final value = style
.merge(scale.resolve(FlTextRole.textSm))
.copyWith(color: theme.colors.onSurface, fontWeight: theme.tokens.typography.weight.medium);
return TextSpan(
children: [
for (final (n, s) in chart.series.indexed)
TextSpan(
text:
'${n == 0 ? '' : '\n'}'
'${chart.series.length == 1 ? _written(s, index, chart.formatValue) : '${s.label} ${_written(s, index, chart.formatValue)}'}',
style: value,
),
TextSpan(
text: '\n${chart.points[index]._spoken}',
style: style.merge(scale.resolve(FlTextRole.textXs)).copyWith(color: theme.colors.onSurfaceMuted),
),
],
);
}
/// Places the tooltip centered on [x], kept within the chart's width, at
/// the bottom of its room.
class _BubblePosition extends SingleChildLayoutDelegate {
const _BubblePosition(this.x);
final double x;
@override
BoxConstraints getConstraintsForChild(BoxConstraints constraints) => constraints.loosen();
@override
Offset getPositionForChild(Size size, Size childSize) => Offset(
(x - childSize.width / 2).clamp(0.0, math.max(0.0, size.width - childSize.width)),
math.max(0.0, size.height - childSize.height),
);
@override
bool shouldRelayout(_BubblePosition old) => old.x != x;
}
/// The tooltip of a selected point: its full label, then its values, on the
/// `tooltip` background and shadow. The point's node already reads it.
class _Bubble extends StatelessWidget {
const _Bubble({required this.chart, required this.index});
final FlChart chart;
final int index;
@override
Widget build(BuildContext context) {
final theme = FlScope.of(context);
final radius = theme.shape.radiusXl;
final scale = theme.typography;
// The spans' styles carry the app's font and fallback fonts: a span that
// names its font loses the parent's fallbacks.
final style = DefaultTextStyle.of(context).style.merge(scale.resolve(FlTextRole.textXs));
final strut = scale.strut(FlTextRole.textXs, inheritedFamily: DefaultTextStyle.of(context).style.fontFamily);
return ExcludeSemantics(
child: FlShadow(
layers: theme.shadows.overlay,
shape: RoundedRectangleBorder(borderRadius: BorderRadius.circular(radius)),
child: DecoratedBox(
decoration: ShapeDecoration(
color: theme.colors.surfaceOverlay,
shape: FlContinuousBorder(radius: radius),
),
child: Padding(
// `.chart-tip`: 6 by 10.
padding: EdgeInsetsDirectional.symmetric(horizontal: theme.space.xs * 2.5, vertical: theme.space.xs * 1.5),
// A single text: a lone line would carry the point node's label,
// and the contrast measurement would take it for it.
child: Text.rich(_bubbleSpan(chart, index, style, theme), strutStyle: strut),
),
),
),
);
}
}
/// The legend of two series (`.chart-legend`): a square mark of 8 for each,
/// the second faded, and its name.
class _Legend extends StatelessWidget {
const _Legend({required this.chart});
final FlChart chart;
@override
Widget build(BuildContext context) {
final theme = FlScope.of(context);
final scale = theme.typography;
final style = scale.resolve(FlTextRole.textXs).copyWith(color: theme.colors.onSurfaceMuted);
final strut = scale.strut(FlTextRole.textXs, inheritedFamily: DefaultTextStyle.of(context).style.fontFamily);
return Wrap(
spacing: theme.space.lg,
runSpacing: theme.space.xs,
children: [
for (final (s, series) in chart.series.indexed)
Row(
mainAxisSize: MainAxisSize.min,
spacing: theme.space.xs * 1.5,
children: [
SizedBox.square(
dimension: theme.space.sm,
child: DecoratedBox(
decoration: ShapeDecoration(
color: s == 0
? series.color ?? theme.colors.selected
: (series.color ?? theme.colors.onSurfaceMuted).withValues(
alpha: (series.color ?? theme.colors.onSurfaceMuted).a * _comparisonAlpha,
),
shape: RoundedRectangleBorder(borderRadius: BorderRadius.circular(theme.shape.radiusXs / 2)),
),
),
),
Flexible(
child: Text(series.label, style: style, strutStyle: strut),
),
],
),
],
);
}
}
/// Selects the point that [to] derives from the intent, enabled only when
/// that point exists and differs from the selected point: Escape with no
/// tooltip open bubbles up to the page.
class _ChartAction<T extends Intent> extends Action<T> {
_ChartAction({required this.to, required this.count, required this.selected, required this.select});
/// The target point; when null, none (the tooltip closes).
final int? Function(T intent) to;
final int count;
final int? selected;
final ValueChanged<int?> select;
@override
bool isEnabled(T intent) {
final index = to(intent);
return index != selected && (index == null || index >= 0 && index < count);
}
@override
void invoke(T intent) => select(to(intent));
}
class _StepIntent extends Intent {
const _StepIntent(this.step);
final int step;
}
class _EdgeIntent extends Intent {
const _EdgeIntent({required this.end});
final bool end;
}
class _ClearIntent extends Intent {
const _ClearIntent();
}
/// The data of a [FlChart] as a table: one row per point, its full label at
/// the start, the value of each series at the end, under a header row. The
/// screen reader reads a table (roles `table`, `row`, `columnHeader` and
/// `cell`); on screen, rows separated by a rule. The alternative to the
/// chart for those who do not read a plot.
class FlChartTable extends StatelessWidget {
/// The table of [points] and [series], the first column named
/// [pointsLabel].
const FlChartTable({
super.key,
required this.points,
required this.series,
required this.formatValue,
required this.pointsLabel,
});
/// The points, one row each.
final List<FlChartPoint> points;
/// The series, one column each.
final List<FlChartSeries> series;
/// Writes a value.
final String Function(double value) formatValue;
/// The header of the first column ("Day").
final String pointsLabel;
@override
Widget build(BuildContext context) {
final theme = FlScope.of(context);
final scale = theme.typography;
final family = DefaultTextStyle.of(context).style.fontFamily;
// `.table`: a muted header, rows 10 high around their text. Semibold
// rather than the canvas's medium: thinner, the Arabic header falls
// below the contrast rule under torture B.
final header = scale
.resolve(FlTextRole.textSm)
.copyWith(color: theme.colors.onSurfaceMuted, fontWeight: theme.tokens.typography.weight.semibold);
final body = scale.resolve(FlTextRole.textSm).copyWith(color: theme.colors.onSurface);
final headerStrut = scale.strut(FlTextRole.textSm, inheritedFamily: family);
final bodyStrut = scale.strut(FlTextRole.textSm, inheritedFamily: family);
final rule = BorderSide(color: theme.colors.separator, width: theme.size.border);
Widget cell(String text, {required bool first, required bool head}) => Expanded(
flex: first ? 3 : 2,
// The node tight around its text: at the column's full width, the
// contrast measurement would mostly read the background.
child: Align(
alignment: first ? AlignmentDirectional.topStart : AlignmentDirectional.topEnd,
child: Semantics(
container: true,
role: head ? SemanticsRole.columnHeader : SemanticsRole.cell,
child: Text(
text,
textAlign: first ? TextAlign.start : TextAlign.end,
style: head ? header : body.copyWith(fontFeatures: const [ui.FontFeature.tabularFigures()]),
strutStyle: head ? headerStrut : bodyStrut,
),
),
),
);
Widget row(List<Widget> cells, {bool head = false}) => Semantics(
container: true,
explicitChildNodes: true,
role: SemanticsRole.row,
child: DecoratedBox(
decoration: BoxDecoration(border: Border(bottom: rule)),
child: Padding(
padding: EdgeInsetsDirectional.symmetric(vertical: head ? theme.space.sm : theme.space.xs * 2.5),
child: Row(crossAxisAlignment: CrossAxisAlignment.start, spacing: theme.space.md, children: cells),
),
),
);
return Semantics(
container: true,
explicitChildNodes: true,
role: SemanticsRole.table,
child: Column(
crossAxisAlignment: CrossAxisAlignment.stretch,
children: [
row([
cell(pointsLabel, first: true, head: true),
for (final s in series) cell(s.label, first: false, head: true),
], head: true),
for (final (i, point) in points.indexed)
row([
cell(point._spoken, first: true, head: false),
for (final s in series) cell(_written(s, i, formatValue), first: false, head: false),
]),
],
),
);
}
}